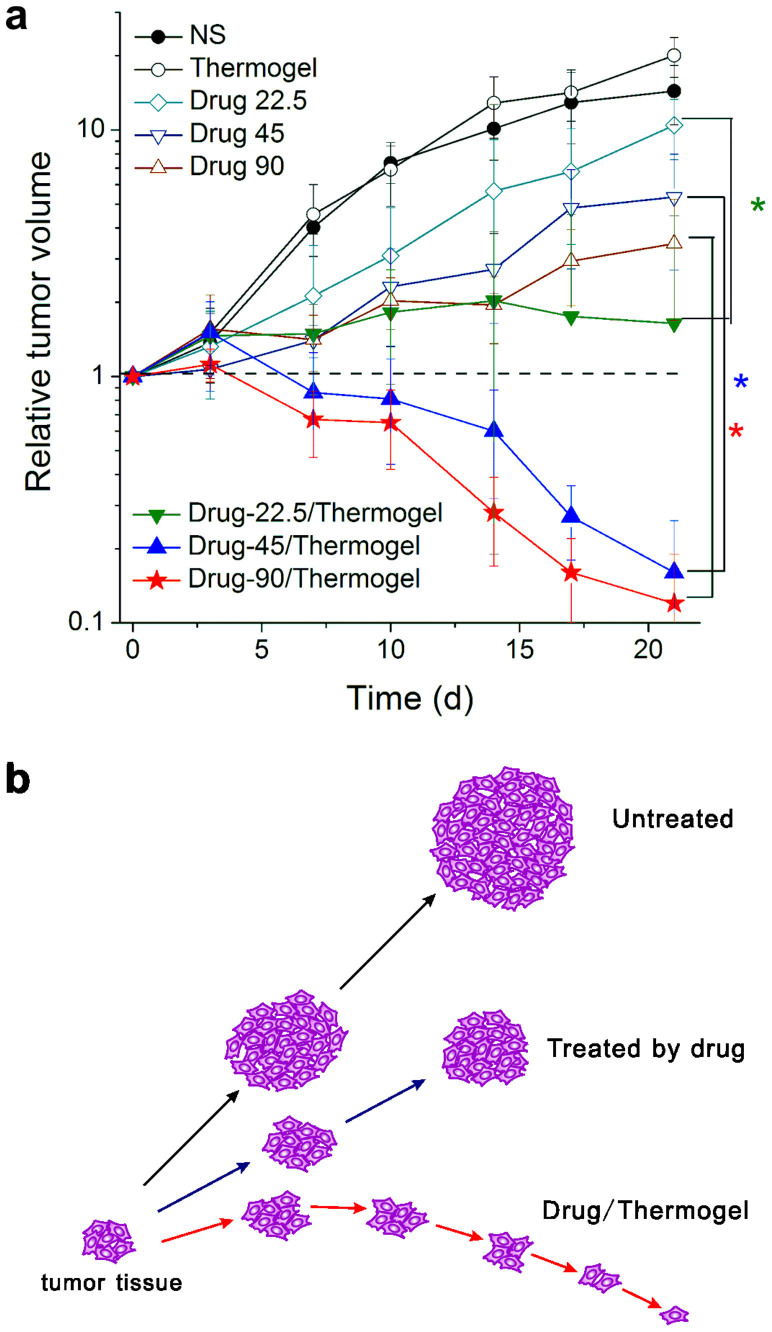
Figure 9. Tumor volume as a function of time in nude mice bearing human SW620 tumors.
(a) The relative tumor volume calculated from equation (3) of the indicated groups (n = 6). The dashed line marks the value of “1”, indicating no change of tumor volume after a cycle of therapy. Student t-tests were conducted on day 21 between the IRN only group and the IRN/thermogel group at the same drug dose, resulting in p values of 0.0003, 0.0048, and 0.0058 for drug doses of 22.5, 45, and 90 mg/kg/w, respectively, all less than 0.05. (b) Scheme of change of tumor volume during therapy. In the untreated group, the tumor volume increased most rapidly; in the IRN-only-treated group, the final tumor volume was smaller than that of the untreated group but still larger than the initial one; in the drug/thermogel group, the tumor volume first slightly increased and then decreased significantly. The final tumor volume was smaller than the initial size.

