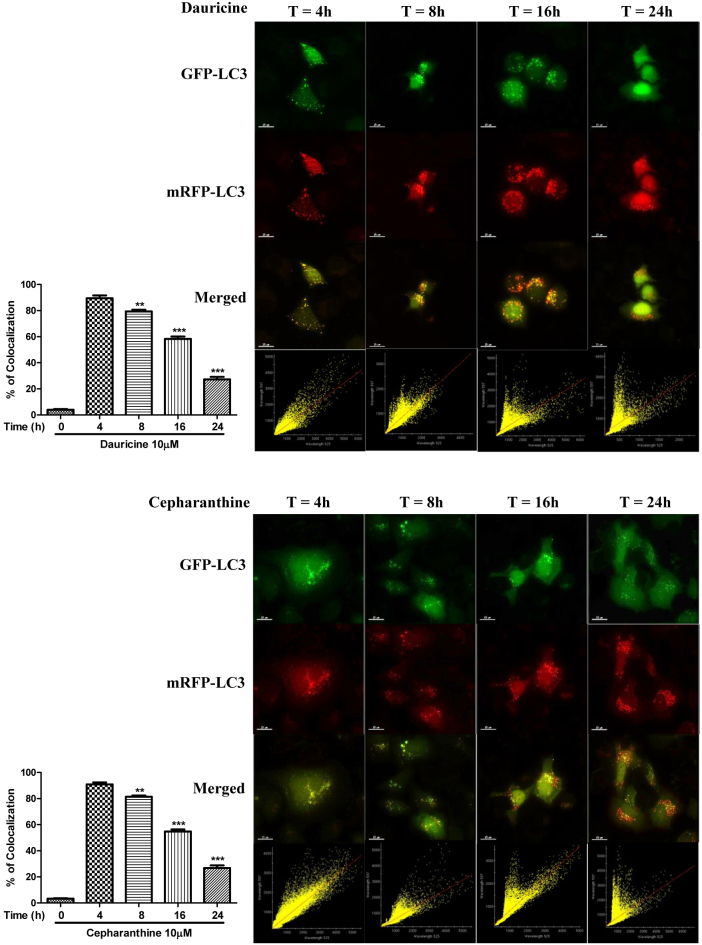
Figure 4. mRFP-GFP-LC3 fluorescence localisation pattern of dauricine and cepharanthine.
HeLa cells were transfected with the mRFP-GFP-LC3 plasmids for 24 h. The cells were then treated with dauricine (10 μM) and cepharanthine (10 μM) for 0–24 h. Cells were then subjected to immunocytochemical analysis and mRFP+-GFP+ (yellow) puncta were scored; scale bar, 15 μm. Each correlation plot is derived from the field shown in the immunofluorescence image. The colocalisation of mRFP with GFP signal from tfLC3 puncta was measured using ImageJ software. The percentage of colocalisation is displayed in the bar chart. The values indicate the average of at least five images. Error bars, S.D. **, P < 0.01; ***, P < 0.001.

