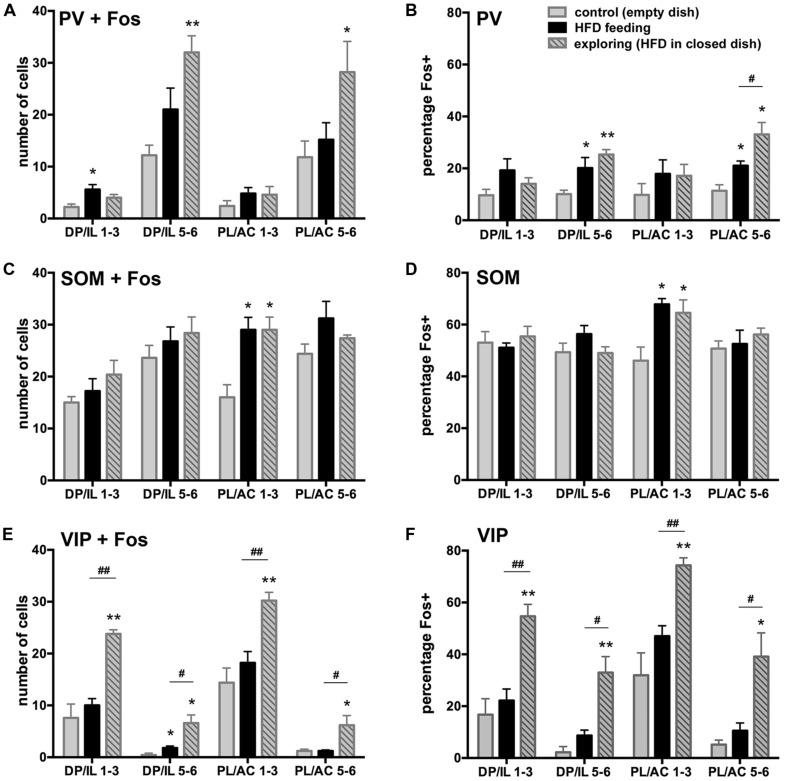
FIGURE 5.
Fos expression in inhibitory interneurons and differences among the experimental groups vary among the three major non-overlapping subpopulations in the medial PFC (PV in A,B, SOM in C,D, VIP in E,F). A,C,E depict the number of double-labeled cells counted, whereas B,D,F show the percentage of the interneuron subpopulations that showed Fos-ir. A,B: HFD exposure led to an increase in Fos-ir in PV neurons most of which were in the deep layers of the DP/IL and PL/AC, and this increase was robust only in the food-driven exploration group. C,D: SOM-labeled neurons in layers 1–3 of the PL/AC showed comparable increases in Fos-ir among the HFD feeding and exploring groups, but no differences between groups were apparent in the other parts of the mPFC, where about half of all SOM-labeled cells were Fos-positive. E,F: Among the VIP neurons, a robust increase in Fos-ir occurred in the food-driven exploration group, whereas HFD feeding led to a small but insignificant rise. *p < 0.05, **p < 0.005, differences with respect to the control group;#p < 0.05, ##p < 0.005, differences between feeding and exploring groups.

