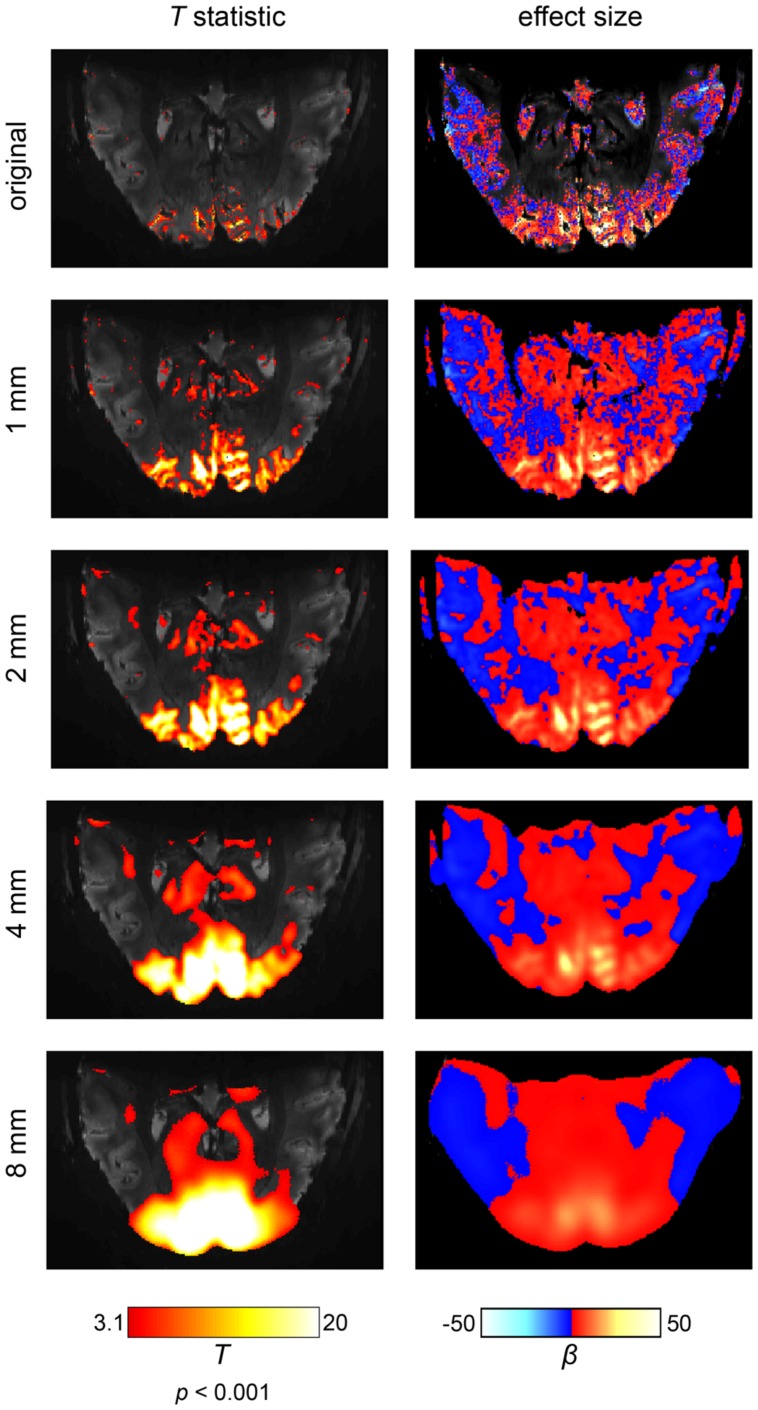
FIGURE 3.
The effects of spatial smoothing illustrated on an ultra-high field fMRI data set at a field strength of 7 Tesla and an isotropic resolution of 0.65 mm. The scanning paradigm comprised a visual checkerboard stimulation (see appendix) and the analysis was based on a simple general linear model. In the left column, the results are displayed in terms of a t-statistic (i.e., significance of activations). In the right column, the corresponding effect sizes are shown (i.e., amplitude of activations). We depicted the original results and four levels of spatial smoothing. When smoothing is omitted, fine-grained activation patterns are visible on the cortical surface (i.e., within gray matter regions). While spatial smoothing increases the statistical significance of the results, both the effect size and spatial accuracy of the results are drastically reduced. Noteworthy, the intrinsic SNR would be increased if a larger voxel size was used or more repetitions were carried out. As result, a larger number of voxels would be labeled active.

