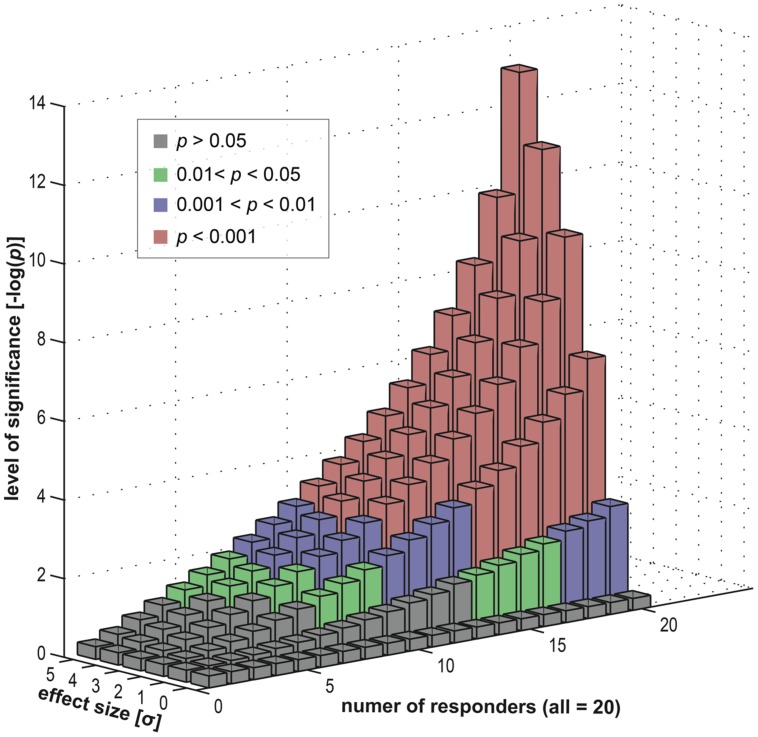
FIGURE 8.
Data simulation investigating the effects of a heterogeneous subject group (in terms of responders and non-responders). We computed group statistics (t-based) for one single location using a group of 20 “virtual” subjects (see appendix). This group consisted of two subgroups, firstly responders and secondly non-responders. The former were sampled from an effect distribution (normal distribution with an offset) and the latter from a null distribution (normal distribution). We varied the composition of the group (i.e., the number of responders versus the number of non-responders) and also the size of the effect (the offset). For each level (20 levels of group composition and six levels of effect sizes) we repeatedly computed a t-based one-sample random-effects analysis, as used in common group level inference. We displayed the resulting statistical significance levels in different colors: green for mild significance (0.01 < p < 0.05), blue for moderate significance (0.001 < p < 0.01) and red for high significance (p < 0.001).

