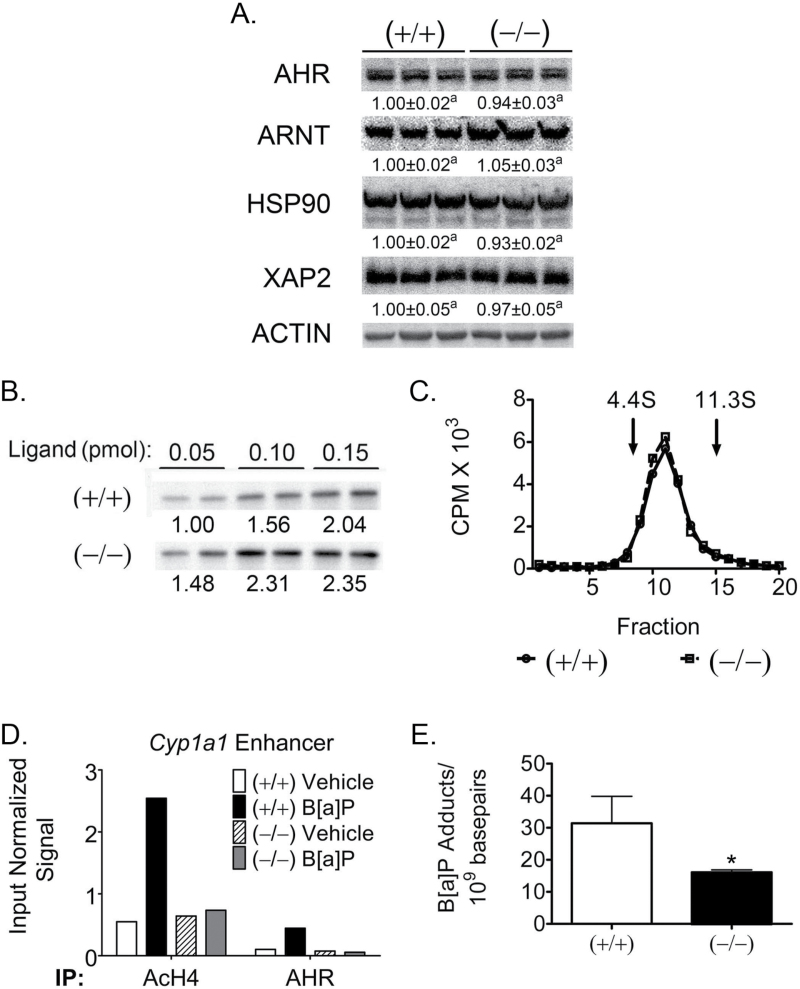
Fig. 4.
Functional differences in AHR-dependent signaling are reduced by PPARβ/δ. (A) Quantitative protein expression of AHR and AHR accessory proteins in wild-type (+/+) and Pparβ/δ-null (−/−) primary keratinocytes normalized to ACTIN expression. Normalized expression values are fold expression relative to (+/+) and represent the mean ± SEM of N = 3 biological replicates. Values with different letters are significantly different than controls (P ≤ 0.05). (B) Level of cytosolic AHR binding of the irreversible photoaffinity ligand 125I-N3Br2DpD. Cytosol from (+/+) and (−/−) keratinocytes was incubated with increasing amounts of radioaffinity ligand with N = 2 technical replicates. Relative binding was determined by gamma counting of the excised bands from the protein blots and normalized to the (+/+) 0.05 pmol average signal. (C) AHR nuclear translocation using reversible ligand 125I-Br2DpD. (+/+) or (–/–) keratinocytes were treated 1h with 125I-Br2DpD, and nuclear extracts were isolated and subjected to sucrose density gradient ultracentrifugation. Isolated gradient factors were quantified by gamma counting, and the marker proteins bovine serum albumin (4.4S) and catalase (11.3S) were used as external standards to evaluate AHR complex status. (D) ChIP to assess promoter occupancy at the Cyp1a1 enhancer element in response to B[a]P. Keratinocytes were treated for 3h with vehicle or 1 μM B[a]P, and ChIP and qPCR quantification was performed. Results are from one biological replicate pooled from keratinocytes isolated from N = 3 neonates. Acetylated histone H4 immunoprecipitation was used as a positive marker of transcriptional activation compared with specific AHR occupancy. (E) Quantitative DNA adduct formation as determined by γ-32P-post-labeling of B[a]P-adducted nucleotides. Keratinocytes were treated 24h with 1 μM B[a]P, and DNA isolation and post-labeling were performed. Values are normalized to nucleotide content and represent the mean ± SEM of quantified number of adducts per 109 basepairs from N = 3 biological replicates. *Significantly different than control (P ≤ 0.05).

