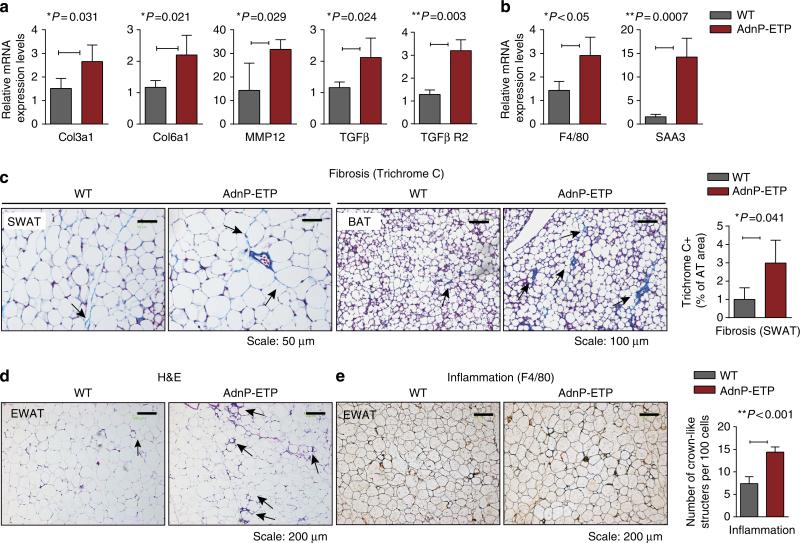
Figure 3. Overexpression of endotrophin locally in adipose tissue stimulates fibrosis and exacerbates inflammation induced by HFD.
(a) Q–PCR analysis for collagen 3α1 and 6α1, TGFβ and its receptor (TGFβ R2) and MMP12 in SWATof endotrophin transgenic mice and their littermate controls (n = 4 for each group, Student's t-test for all the P-values) after 8 weeks of exposure to HFD plus Dox. (b) Q–PCR analysis for adipose tissue inflammation-related genes F4/80 and SAA3 in SWAT of endotrophin transgenic mice and their littermate controls (n = 4 for each group, Student's t-test for both the P-values). (c) A Masson's trichrome stain of SWAT (left panels) and BAT (right panels) from endotrophin transgenic mice and their littermate controls. Scale bars, 50 μm for SWAT and 100 μm for BAT. The right panel shows the quantitative measurements of the stain in SWAT by ImageJ software (Student's t-test, P = 0.041). (d) H&E staining of EWAT from endotrophin transgenic mice and their littermate controls. The arrows point to the CLS formed by macrophage aggregation in HFD-fed mice. Scale bars, 200 μm. (e) Immunohistochemical staining of F4/80 in EWAT from endotrophin transgenic mice and their littermate controls (left panels). Note the CLS formed by macrophage aggregation in HFD-fed mice. The right panel shows quantitative measurements of the numbers of CLS (n = 5 per group, Student's t-test, P<0.001). Scale bar, 200 μm.

