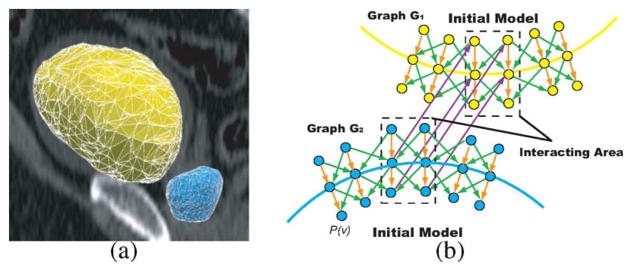
Fig. 11.

Segmentation of the prostate and bladder. (a) Triangular meshes for the bladder (yellow) and the prostate (blue) based on initial models. (b) Corresponding graph construction. An example 2-D slice is presented. p(v) represents the column with respect to the vertex v on the mesh. Dots represent nodes ni ∈ Gi. Two sub-graphs G1 and G2 are constructed for the segmentation of the bladder and the prostate, respectively. Note that in the region of interaction (dashed box), a corresponding column in G2 exists for each column in G1 with the same position. The inter-surface arcs (purple) between corresponding columns enforce the surface context constraints in the interacting region.
