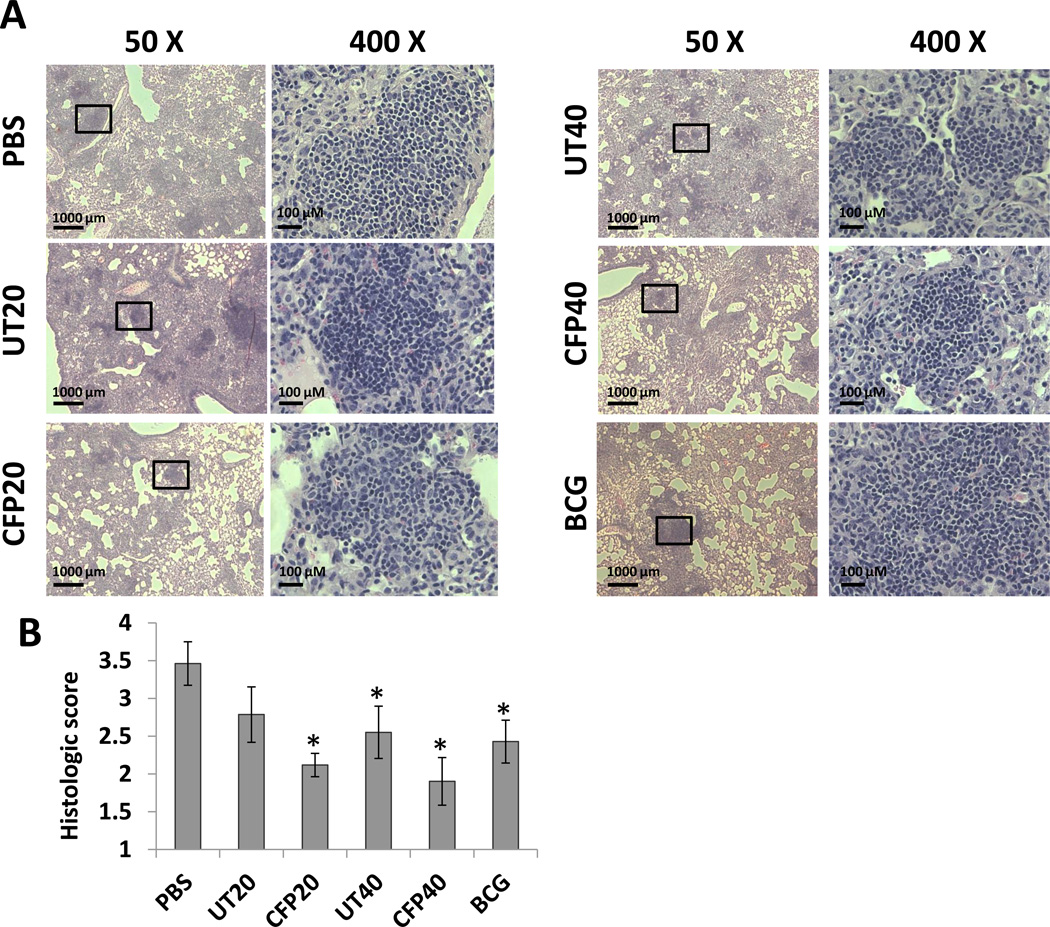
Figure 6. Lung histopathology in M. tuberculosis-infected mice.
H&E staining of lung sections from vaccinated and non-vaccinated mice following infection with virulent M. tuberculosis H37Rv. (A) The lung sections were analyzed under low (50X) and high (400X) magnification. (B) Histopathological scores of lung sections. PBS and BCG were used as a negative and positive control, respectively. Sections are representatives of lung sections from 4 mice per group and from one of three independent experiments. *, p<0.05 compared to the PBS group (one-way ANOVA with Tukey post-test).

