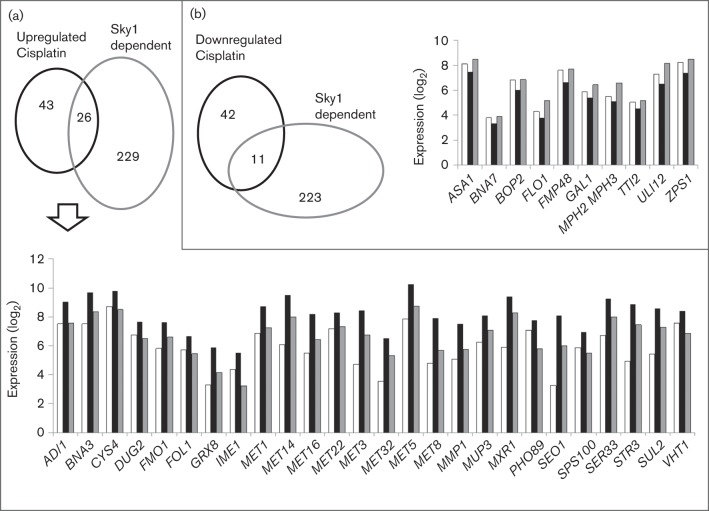
Fig. 1.
Genes that change their mRNA levels in response to cisplatin treatment and are dependent on Sky1 function. (a) Upregulated genes. The Venn diagram shows the intersections between genes in Tables S1 and S6. (b) Downregulated genes. The Venn diagram shows the intersections between genes in Tables S2 and S5. Histograms show the levels of gene expression corresponding to the genes from intersections of the accompanying Venn diagrams in the three conditions compared: white bars, W303 strain; black bars, W303 strain treated with cisplatin; grey bars, Δsky1 strain treated with cisplatin.

