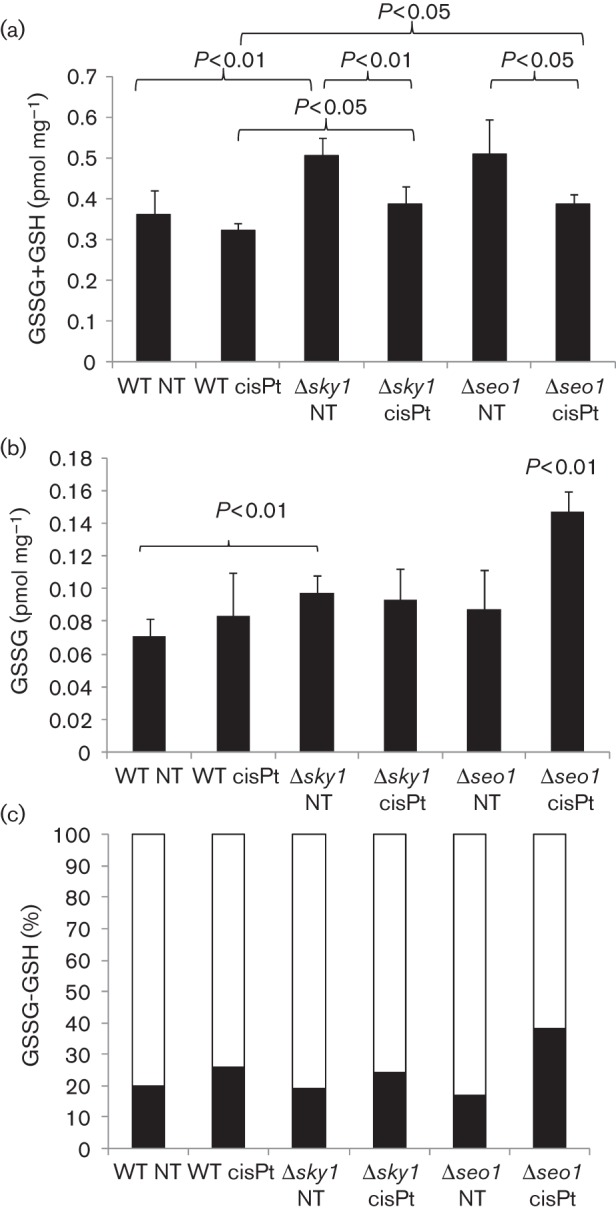
Fig. 5.

Glutathione determination in W303, W303-Δsky1 and W303-Δseo1 strains after cisplatin treatment (a) Total (GSSG+GSH), (b) GSSG, and (c) per cent GSSG (black) and GSH (white). NT, not treated; cisPt, cisplatin treatment. The P value is indicated when statistically significant differences were found and the corresponding pair comparisons are indicated by brackets. In (b), the absence of brackets in the comparison of W303-Δseo1 cisPt indicates that all pair comparisons are significant.
