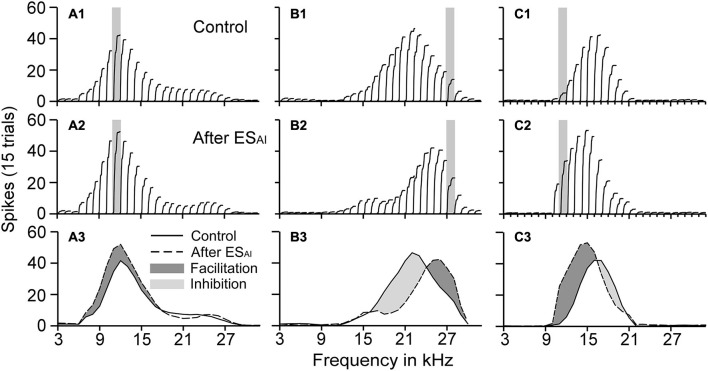
Figure 2.
Three examples illustrating the effects of the ESAI on the frequency tunings of DCN neurons (A–C). The ESAI did not change the BF but increased the auditory responses of the matched DCN neurons (A1, A2), while the BFs of the unmatched DCN neurons shifted towards the cortical BF (B1, B2 and C1, C2). The ESAI caused facilitation (A3, B3, C3) and inhibition (B3, C3) of DCN auditory responses. The gray bars in the top two rows of panels represent the BFs of the stimulated cortical neurons. In the bottom row of panels, the dark gray area represents facilitation, whereas the light gray area represents inhibition.

