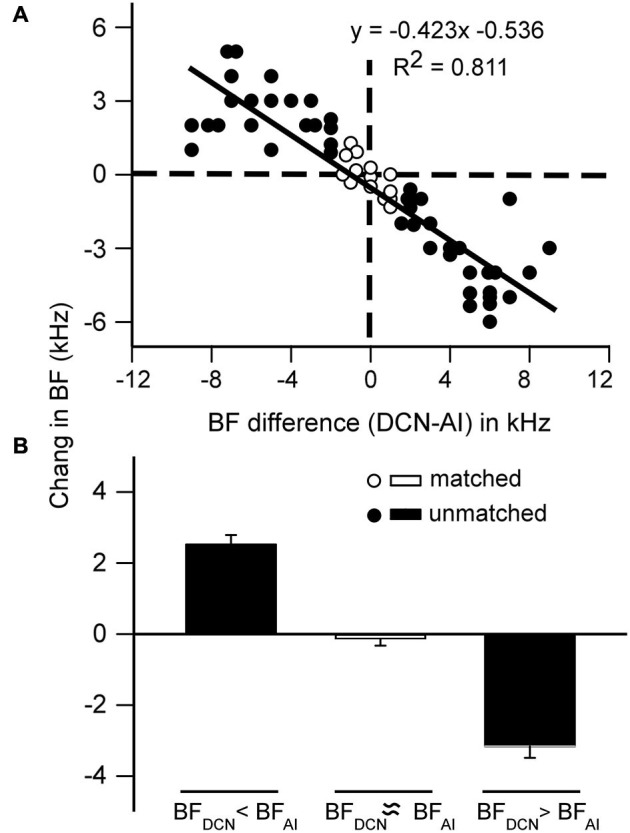
Figure 4.

Frequency-specific changes in the BF of DCN neurons after contralateral cortical stimulation. (A) The degree of change was systematically correlated to the BF difference between the AI and DCN neurons. Open circles, BF shift of neurons with matched BF; filled circles, BF shift of neurons with unmatched BF. (B) The averaged BF change after cortical stimulation. Open bar indicates the BF shift of neurons with matched BF; filled bars indicate the BF shift of neurons with unmatched BF. The error bars represent the SEM.
