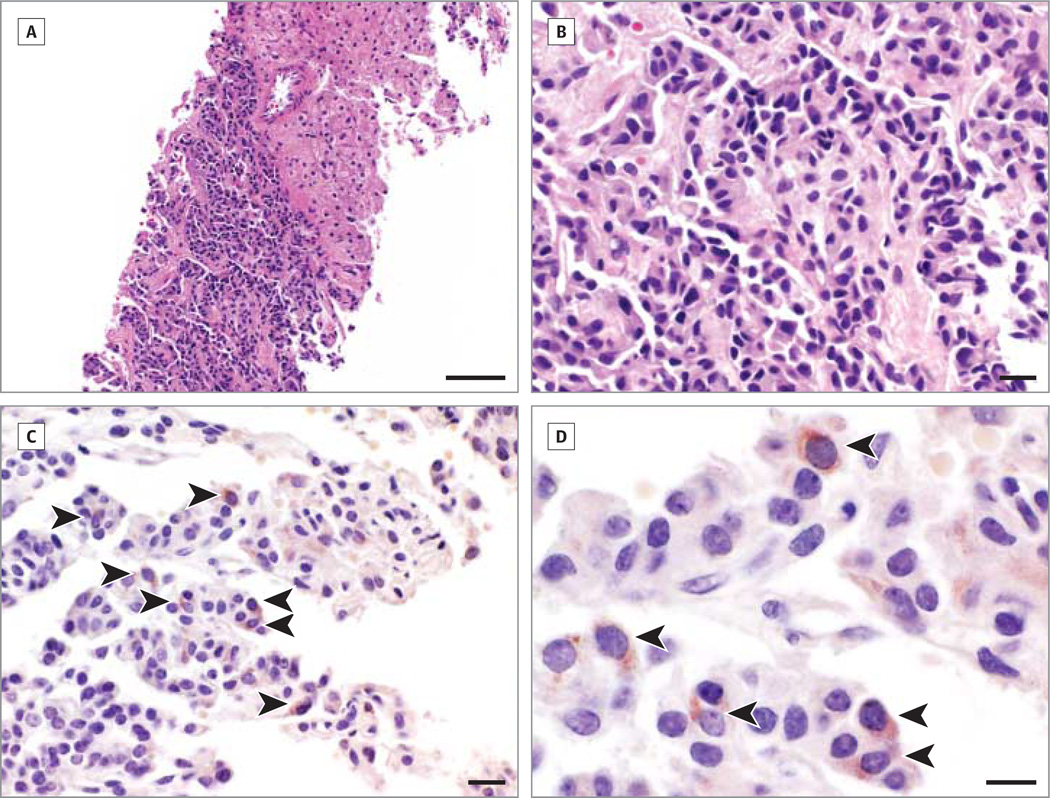
Figure 2. Aquaporin-4 Immunoreactivity in Carcinoid Tumor Cells.
A, There is a sharp border between the hypercellular tumor (lower left) and normal liver parenchyma (upper right; hematoxylin and eosin). B, Tumor cells are shaped irregularly with hyperchromatic nuclei and pink cytoplasm (hematoxylin and eosin). C, Aquaporin-4–positive tumor cells (reddish cytoplasm) are relatively sparse and scattered within nests of nonimmunoreactive tumor cells (arrowheads). D, Aquaporin-4 immunoreactivity appears to be predominately cytoplasmic (arrowheads). Scale bars indicate 100 µm (A), 20 µm (B and C), and 10 µm (D).

