
Figure 1.
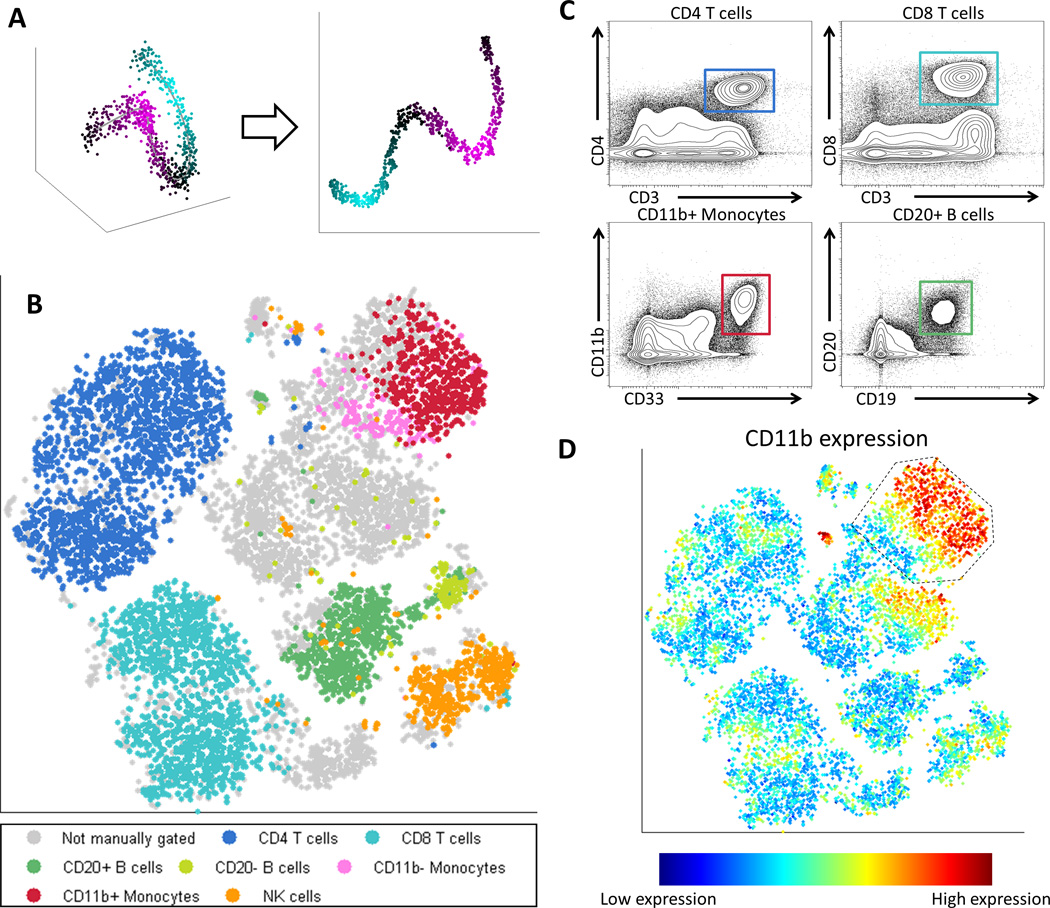
viSNE, a Nonlinear Dimensionality Reduction algorithm, creates a map of the immune system. (A) In this toy example, viSNE projects a one-dimensional curve embedded in 3D (left) to 2D (right). The color gradient demonstrates that nearby points in 3D remain close in 2D. (B) Application of viSNE to a healthy human bone marrow sample [21]. viSNE automatically separates cells based on their subtype (see Supplementary Figure 1 for further analysis). Each point in the viSNE map represents an individual cell and its color represents its immune subtype based on independent manual gating. The axes are in arbitrary units. (C) Biaxial plots representing the same data shown in 1B, select subpopulations are shown with canonical markers, square color matches subtype in 1B. The actual gating used is more complex and uses a series of biaxial plots for each population [21]. Note, unlike 1B, these plots do not separate between all subtypes in a single viewpoint. (D) The same viSNE map represented in 1B, this time each cell is colored based on CD11b expression. Gated cells are all CD33 high and show a CD11b (maturity) gradient. Many of these cells were not classified as monocytes by manual gating (grey cells 1B).