
Figure 5.
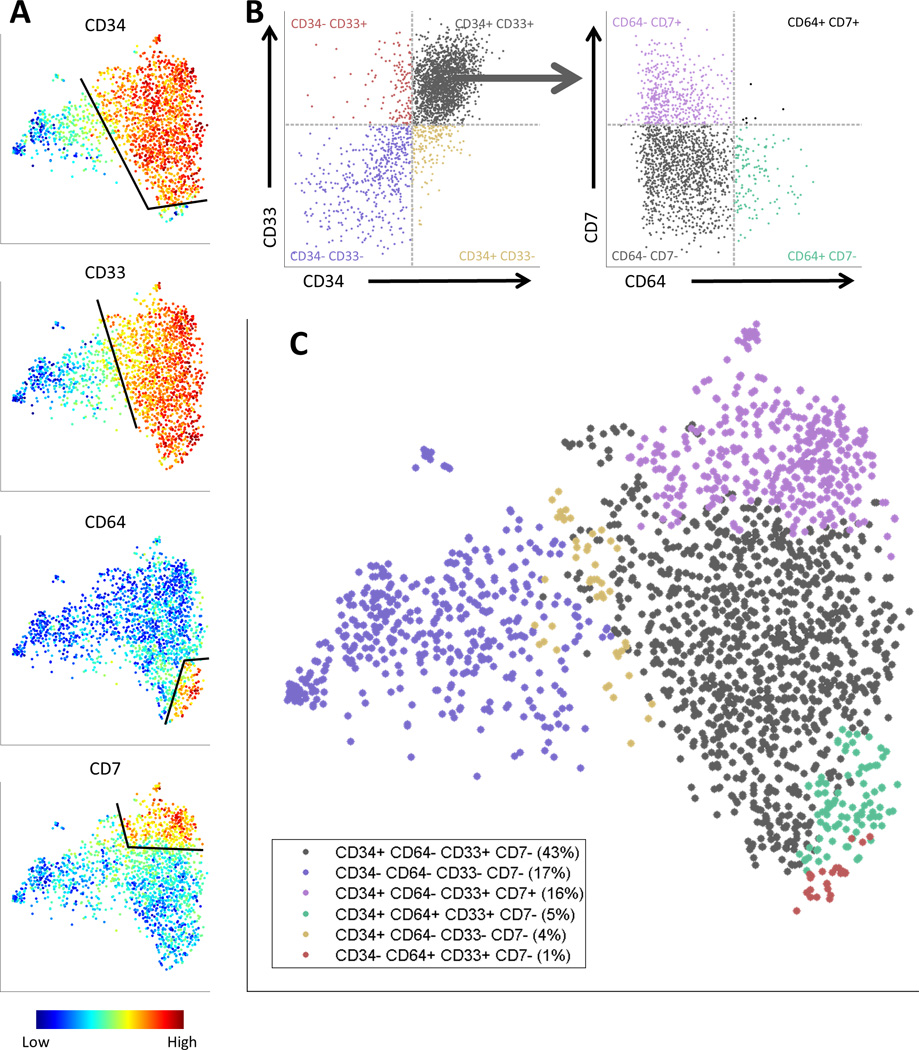
A gating scheme for fluorescence-activated cell sorting (FACS) of the AML relapse sample based on the viSNE map. (A) The viSNE map, colored by (from top to bottom) CD34, CD33, CD64 and CD7. For each marker, cells were separated into two subpopulations: “on” (positive) and “off” (negative), based on an expression threshold for the marker (black lines). (B) Left: Biaxial plot of CD34 versus CD33, demonstrating the intersection of each of the CD34+/− subpopulations with each of the CD33+/− subpopulations. Each point is a cell, the X-axis is CD34 expression level and the Y-axis is CD33 expression level. The 4 quadrants correspond to different CD34+/− and CD33+/− combinations; the cells are colored and labeled by the quadrants. Right: Biaxial plot of CD64 versus CD7, demonstrating the intersection of the CD34+ CD33+ subpopulation with each of the four CD64+/− CD7+/− subpopulations. The X-axis is CD64 expression and the Y-axis is CD7 expression. As in the left side, the cells are colored and labeled by the quadrants. (D) The six subpopulation gating scheme projected onto the viSNE map. Cells are colored by their respective subpopulation from B. The relapse sample can now be sorted into these subpopulations via fluorescence-activated cell sorting (FACS) and further studied through downstream experiments such as DNA and RNA sequencing.