
Figure 6.
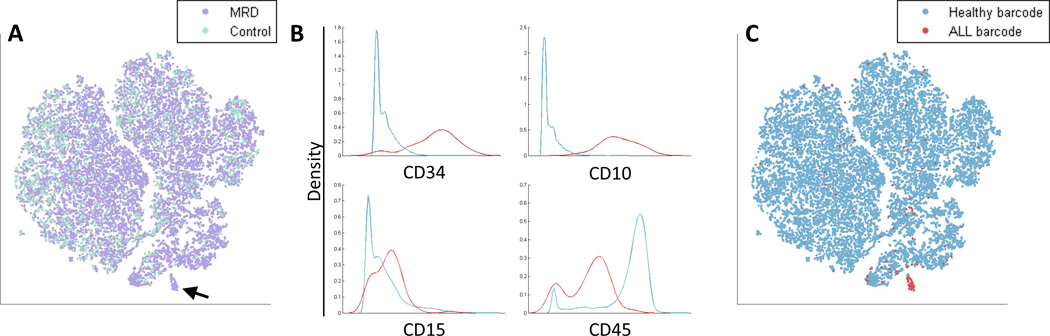
Identification of Minimal Residual Disease (MRD). (A) An in vitro synthetic MRD sample was created by spiking a healthy sample with ALL cells (see Methods). The viSNE map of the MRD sample (purple) and a healthy control sample (cyan) includes a suspect region (marked by an arrow) that is almost entirely cells from the MRD sample (purple). (B) Marker expression of cells in the suspect region (red) and the non-suspect region (cyan). Marker distributions are plotted, x-axis represents marker expression level and y-axis represents density of cells. The suspect region is CD34+ CD10+ CD15+ CD45−, a possible fingerprint for ALL. (C) The viSNE map from 6A, color coded by healthy barcode (cyan) and ALL barcode (red). The suspect region is indeed almost entirely composed of ALL cells. The viSNE algorithm was blinded to this barcode, yet managed to separate this small sub-population from the healthy cells. ALL cells outside of the suspect region have marker expression levels conforming to healthy cells. See Supplementary Figure 13 for an additional example.