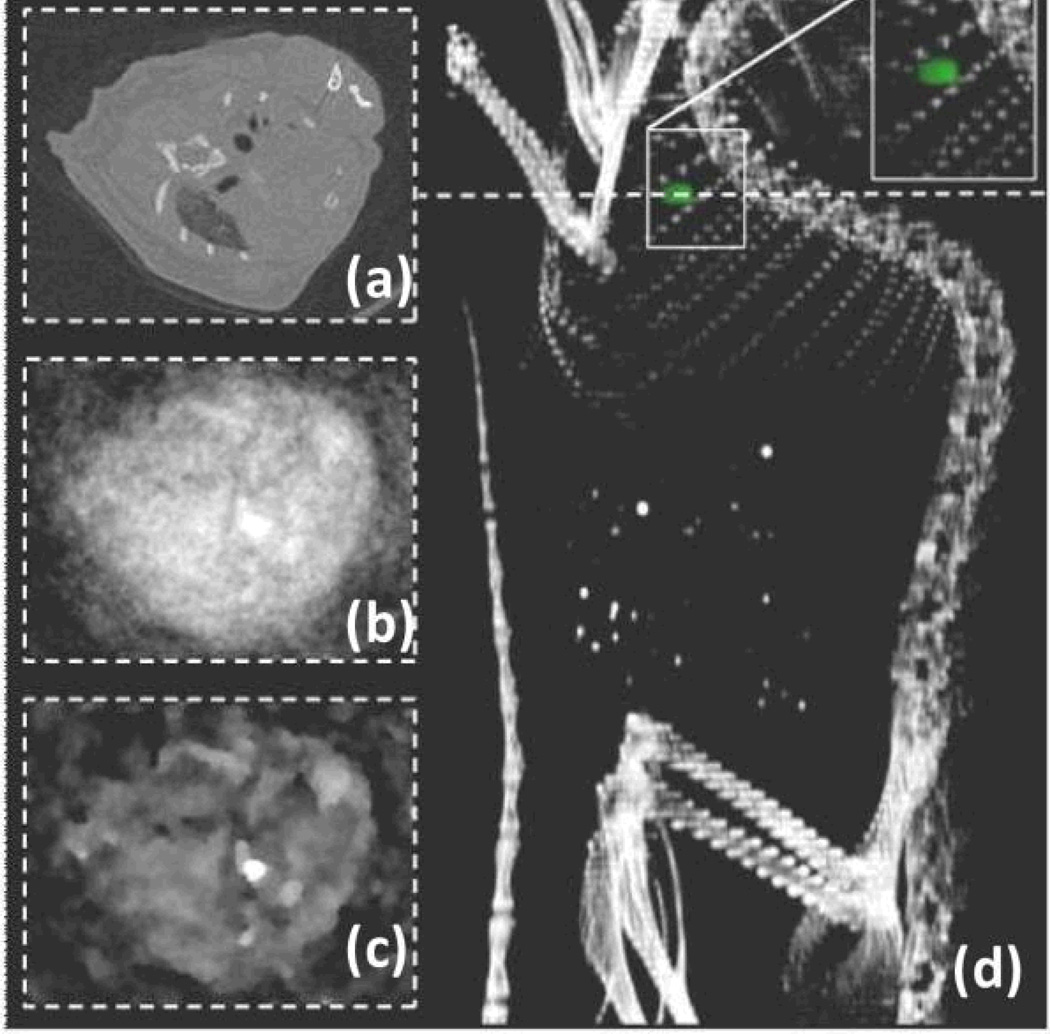
Figure 10.
Blood pool imaging in mouse after bolus application of nontargeted Yb nanocolloids (6ml/kg). (a) Pseudo-conventional CT image composed from spectral measurements, slice through heart (dashed line). Statistical image reconstruction of Yb signal after 1 (b) and 20 iterations. (c) The volume rendered conventional CT image with super positioned Yb signal (green) shows accumulation of Yb in the heart and the clear separation from bone (d).

