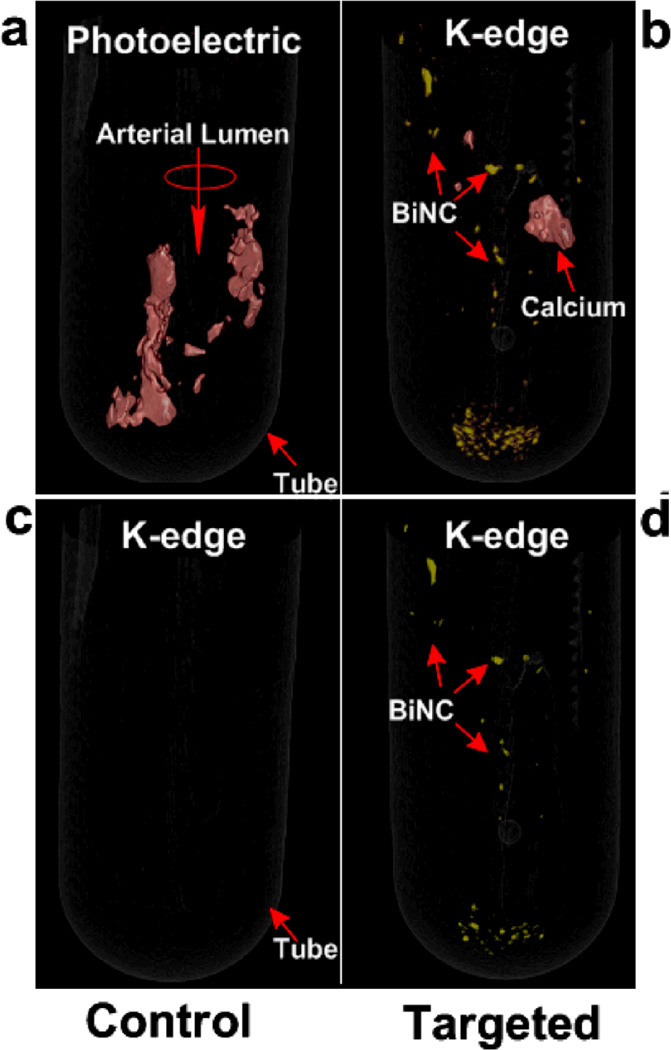
Figure 4.
(a) Photoelectric image of CEA specimen targeted with CoNC showing calcium (presented in red); (b) Spectral CT image of CEA specimen targeted with CoNC revealing no presence of the K-edge metal; (c) photoelectric image of CEA specimen targeted with NanoK showing but not differentiating the attenuation contrast of both plaque calcium and the fibrin-targeted NanoK; (d) Spectral CT image of CEA specimen after fibrin-targeted NanoK showing the spatial distribution and sparse concentration of thrombus remaining on human carotid specimen. Note: Fibrin targeted NanoK signal at the bottom of the tube represents thrombus dislodged from CEA during processing.

