Figure 3.
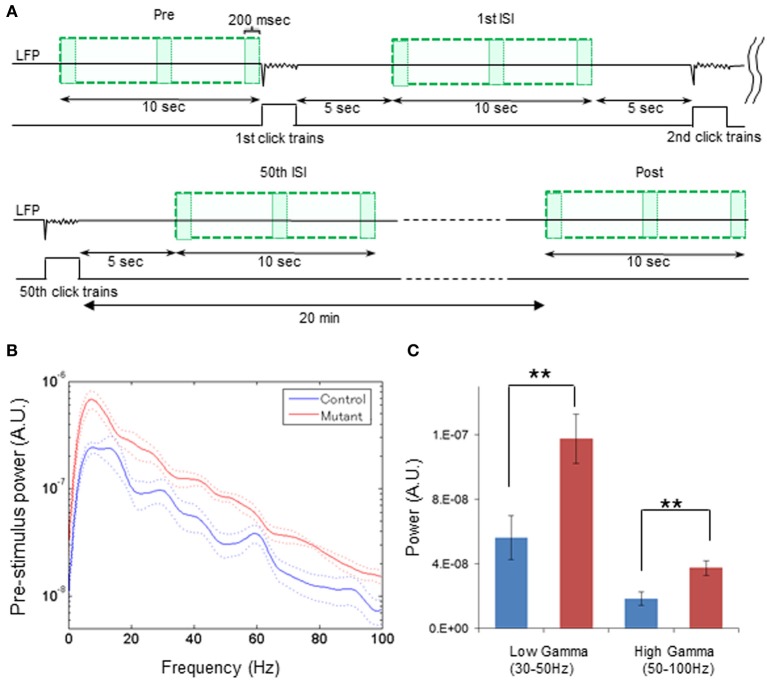
Broadband elevation of mutant spontaneous LFP power during pre-stimulus period. (A) Schematic diagram indicates the analysis periods of spontaneous LFP power during pre-stimulus period (Pre), following the first ASSR stimuli [1st inter-stimulus interval (ISI)], following the 50th ASSR stimuli (50th ISI), and during post-stimulus period (Post). For a pre-stimulus period, z-score normalized LFPs (top line) during last 10 s (upper left green square) before the first click train onset were analyzed with FFT algorism with every 200-ms bin (each box). During ASSR sessions, LFP data from 5 to 15 s (200-ms bin) after the 1st stimuli (upper right green square), the 25th stimuli (not shown), and 50th stimuli (bottom left green square) were analyzed with FFT algorithm. For a post-stimulus period, LFPs were obtained from a 10-s period (bottom right green square) 20 min after cessation of the last click trains were analyzed with FFT algorithm (200-ms bin). (B) Z-score normalized spectral density power during pre-stimulus period from control (blue) and mutant (red) mice (control: n = 7, mutant: n = 6). Dotted lines: mean ± s.e.m. A 60-Hz bump in control LFP power spectra was due to power line noise contamination. (C) Averaged spontaneous LFP powers at low gamma (30–50 Hz), high gamma (50–100 Hz) frequency range were higher in mutant (red) mice compared to control mice (blue). **p < 0.01, unpaired Student's t-test.

