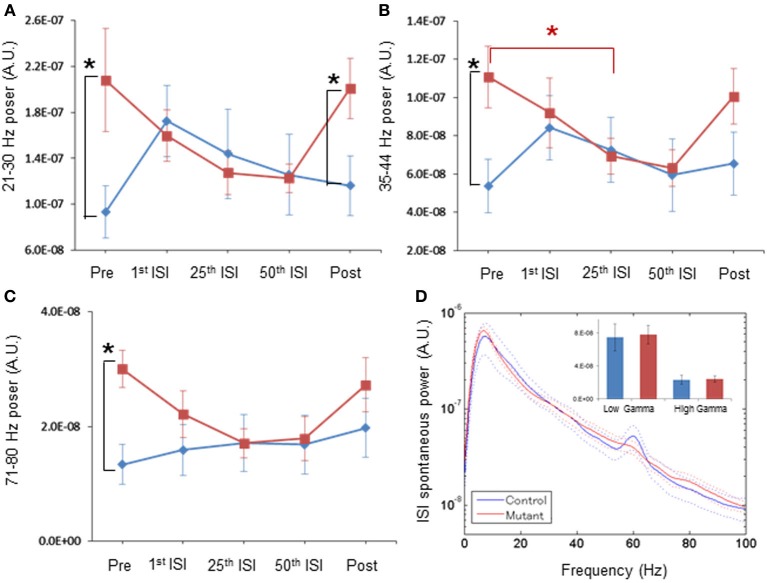
Figure 4.
Normal magnitude of baseline LFP power during periods of periodic ASSR stimuli, by per-animal design. (A) Transition of z-score normalized spontaneous LFP powers per animal at 21–30 Hz frequency in control (blue) and mutant (red) mice during Pre (pre-stimulus period), 1st ISI (first inter-stimulus interval), 25th ISI, 50th ISI, and Post (post-stimulus period). *p < 0.05. (B) Transition of spontaneous LFP powers at 35–44 Hz in control (blue) and mutant (red) mice. *p < 0.05. (C) Transition of spontaneous LFP powers at 71–80 Hz in control (blue) and mutant (red) mice. *p < 0.05. Repeated-measures ANOVA followed by post-hoc Bonferroni testing. (D) No differences in averaged spontaneous LFP power amplitudes in the first, the 25th and the 50th ISIs, across frequencies between control (blue, n = 7) and mutant (red, n = 6) mice. The inset shows no difference in average LFP power amplitudes at low gamma (30–50 Hz) and high gamma (50–100 Hz) frequency. A 60-Hz bump in control LFP power spectra was due to power line noise contamination. Dotted lines: mean ± s.e.m.

