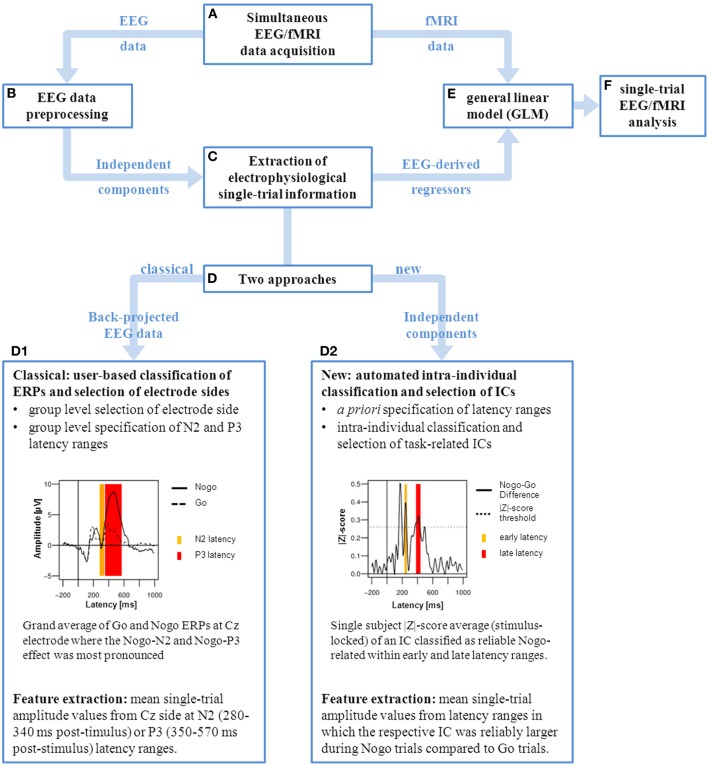
Figure 1.
Graphical representation of single-trial EEG/fMRI analysis. After simultaneous EEG/fMRI data acquisition (A) the EEG data is preprocessed and corrected for fMRI artifacts (B) using independent component analysis (ICA). Subsequently the electrophysiological single-trial values can be extracted (C) using different approaches (D). Classically (D1), single-trial amplitude values are extracted from predefined ERP components. This is based on a chosen electrode site where the ERP component of interest (Nogo-N2 and Nogo-P3) is most pronounced in the grand mean average. Followed by the specification of N2 (280–340 ms, yellow) and P3 (350–570 ms, red) latency ranges which cover best the task-related ERP effects on group level at the selected electrode site (Cz). For each participant the mean single-trial values are extracted from these predefined latency ranges. Alternatively (D2), our approach allows to extract single-trial values from independent components (ICs) which are intra-individually classified and selected in an automated procedure. This is based on a priori specification of latency ranges of interest, in this case located prior (early, yellow) and around (late, red) the individual’s median response time (RT). ICs are intra-individually classified according their association with the Nogo condition (significantly increased amplitudes in Nogo trials compared to Go trials). For each participant the mean single-trial values are extracted from latency ranges in which the respective IC was reliably larger during Nogo. In both approaches the resulting electrophysiological regressors are included in the general linear model of fMRI data analysis (E) in order to perform the single-trial EEG/fMRI data analysis (F).

