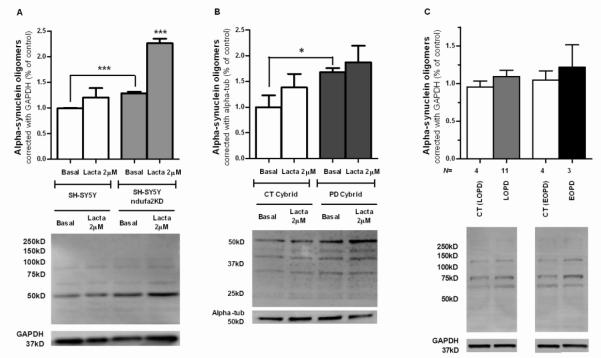
Figure 1. aSN aggregation in PD cellular models.
(A) Densitometry analysis of triton-soluble aSN oligomers in SH-SY5Y ndufa2 KD cells and representative WB. N=3, ***p<0.001. (B) Densitometry analysis of triton-soluble aSN oligomers in PD Cybrids and representative WB. N=3, *p<0.05 (C) Densitometry analysis of triton-soluble aSN oligomers in PD patients PBMC and representative WB.

