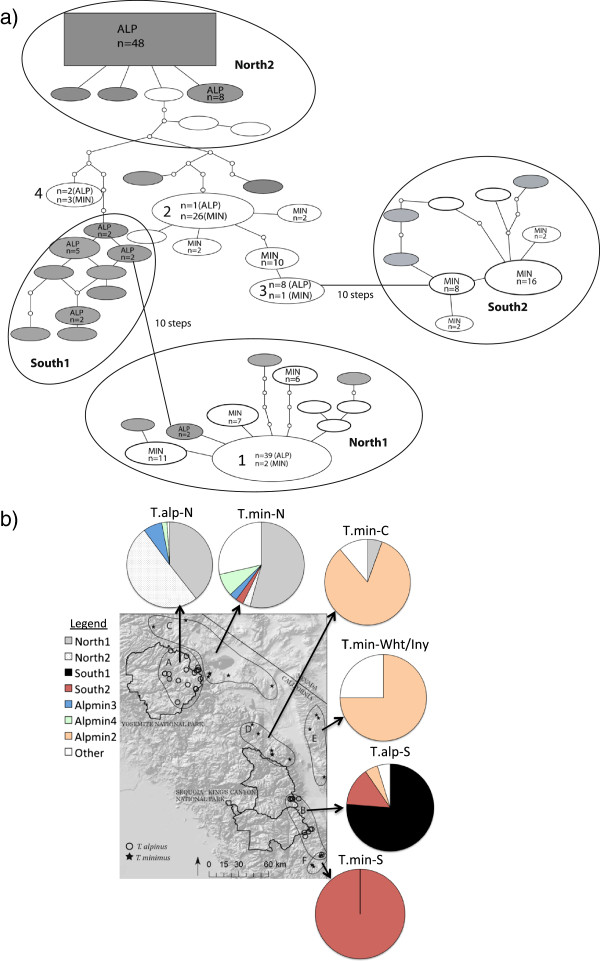
Figure 3.

Haplotype network and map of major haplogroups.a) 95% Statistical parsimony haplotype network for cyt b. Haplotypes are indicated as ovals and scaled by frequency (also noted within oval unless haplotype is unique). Gray represents T. alpinus haplotypes, white represents T. minimus haplotypes and numbered shapes represent shared haplotypes 1) AlpMin1, 2) AlpMin2, 3) AlpMin3, and 4) AlpMin4. Large ovals show groups of individuals with similar haplotypes (“haplogroups”) from the same geographic region. There are two distinct northern haplogroups (North1 and North2) and two distinct southern haplogroups (South1 and South2). If haplotypes are not encompassed within an oval, no geographic pattern exists (i.e, found throughout sampling area); b) Pie charts showing the percentage of individuals from each geographic sampling group belonging to the major haplogroups and shared haplotypes (Alpmin 2, 3, & 4; note that Alpmin1 is within Haplogroup North1).
