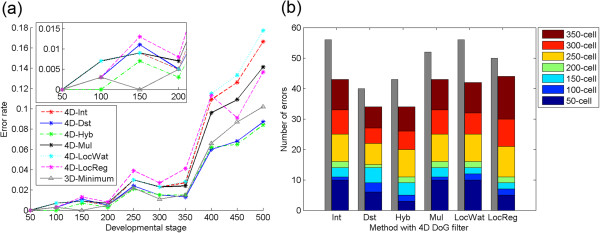
Figure 3.

Detection accuracy of the methods with a 4D DoG filter. (a) Error rate at each developmental stage. The inset is from the 50- to 200-cell stages. The lowest error rates at each stage for all the methods with a 3D DoG filter are shown (gray line with triangle markers). (b) Cumulative number of total errors between the 50- to 350-cell stages. The number of total errors by the methods with a 3D DoG filter is shown (gray bar).
