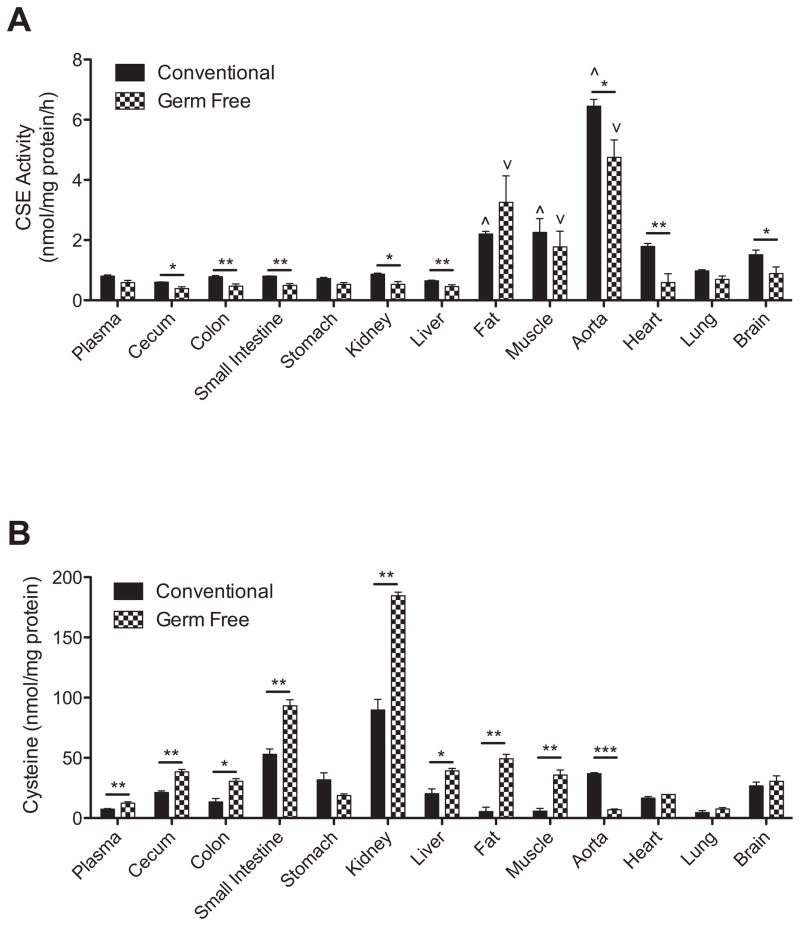
Figure 5. Organ tissue CSE activity and cysteine levels in conventional and germ free mice.
Panel A reports differences in tissue CSE enzyme activity levels as reported as nanomoles of substrate consumed per mg of total protein. ^p<0.05 tissues with significantly higher amounts of CSE enzyme activity in conventional mice. ∨p<0.05 tissues with significantly higher amounts of CSE enzyme activity in germ free mice. *p<0.05 and **p<0.01 conventional versus germ free tissue CSE enzyme activity. Panel B illustrates tissue cysteine levels as nanomoles per mg of total protein between conventional and germ free mice. *p<0.05, **p<0.01 and ***p<0.001 conventional versus germ free tissue cysteine levels. n=10.

