Figure 3.

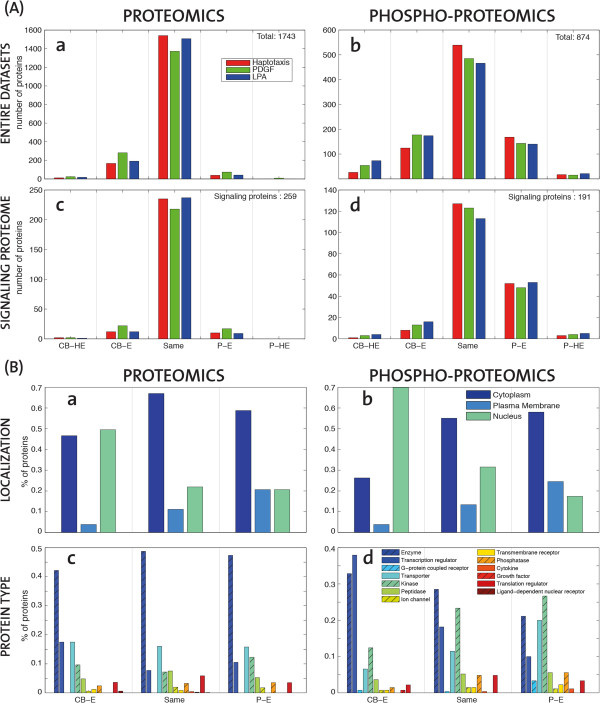
Subcellular distribution of proteins and phospho-proteins in the different cell migration modes. (A) Migration-mode dependent distribution of proteins in different cell compartments. Histograms report the number of proteins in the three cell migration modes (Red-HAPTO, Green-PDGF, Blue-LPA). Pseudopod highly-enriched (P-HE) are more than 5-fold enriched in pseudopod; Pseudopod enriched (P-E) are 2 to 5 fold enriched in the pseudopod; Same enrichment (Same) are equally distributed in the cell; Cell-body enriched (CB-E) are 2 to 5 fold enriched in the cell-body; Cell-body highly-enriched (CB-HE) are more than 5-fold enriched in cell-body. The different plots correspond to (a) all proteomic dataset (1743 gene names), (b) all phosho-proteomic dataset (874 gene names), and (c) the subset of proteins (259) or (d) phosho-proteins (191) that belong to a previously defined signalling proteome [5]. (B) “Spatial” distribution of protein localization and protein types. Percentage of proteins belonging to the three main cellular components (a,b), or the main protein types (c,d) with respect to the protein sets belonging to the distinct “spatial” regions of the cell implied by their relative enrichment ranges (as in Figure 3A, without specifying the highly-enriched (HE)) irrespective of cell migration mode.
