
Figure 2.
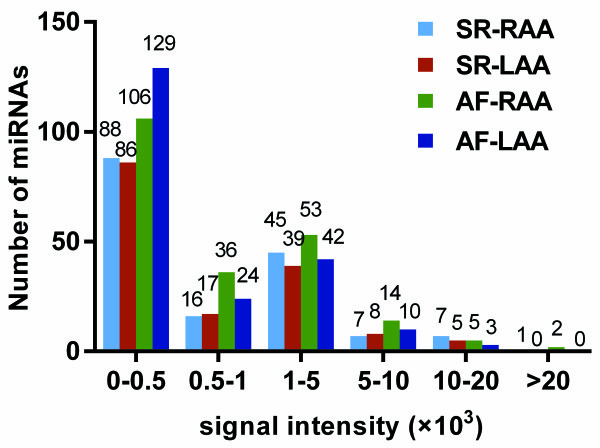
Signal distributions of all detected miRNAs in SR-RAA, SR-LAA, AF-RAA and AF-LAA. The signal intensities of most of these miRNAs were low (0–500 units), with only 23 miRNAs showing intensities greater than 10000 units.
Official websites use .gov
A
.gov website belongs to an official
government organization in the United States.
Secure .gov websites use HTTPS
A lock (
) or https:// means you've safely
connected to the .gov website. Share sensitive
information only on official, secure websites.
Signal distributions of all detected miRNAs in SR-RAA, SR-LAA, AF-RAA and AF-LAA. The signal intensities of most of these miRNAs were low (0–500 units), with only 23 miRNAs showing intensities greater than 10000 units.