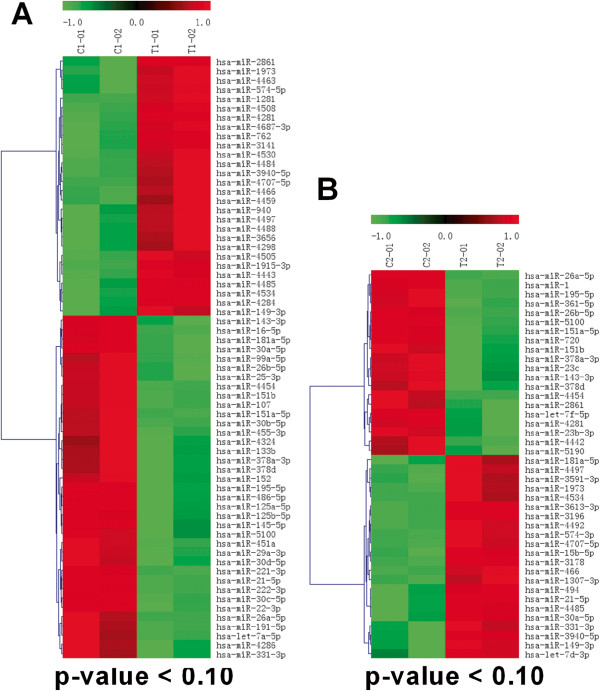
Figure 3.

Heat map showing the miRNAs significantly dysregulated in RAA and LAA tissues. (A) Heat map showing the expression of dysregulated miRNAs in RAA tissues (AF-RAA vs SR-RAA). (B) Heat map showing the expression of dysregulated miRNAs in LAA tissues (AF-LAA vs SR-LAA).
