
Figure 4.
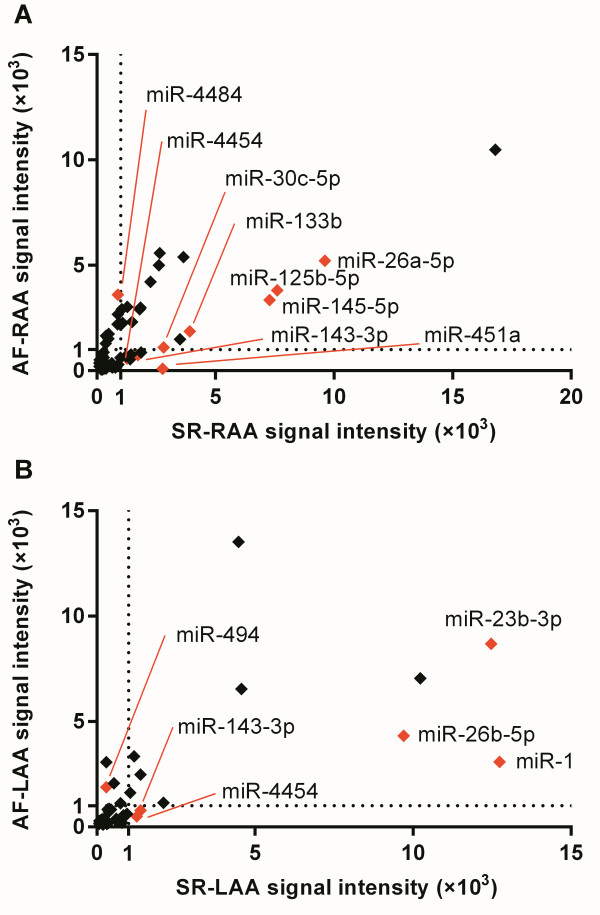
Comparison of signal intensities of miRNAs significantly dysregulated in RAA and LAA tissues. The signal intensities of miRNAs expressed in the SR group (x-axis) and AF group (y-axis) were compared. The miRNAs with the higher signal intensities (>1000 units) either on the x-axis or y-axis were labelled red. (A) AF-RAA vs SR-RAA. (B) AF-LAA vs SR-LAA.