
Figure 5.
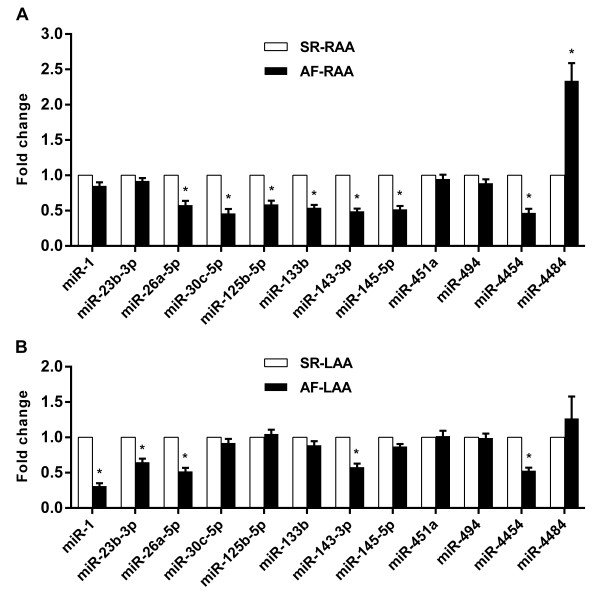
Validation of the miRNA microarray data using qRT-PCR. RNU6B was used as an internal control for normalizing the results. Data are reported as mean ± standard deviation for three independent experiments. Statistically significant differences between the two groups are indicated by *P < 0.05, compared with SR-RAA (A) or SR-LAA (B).