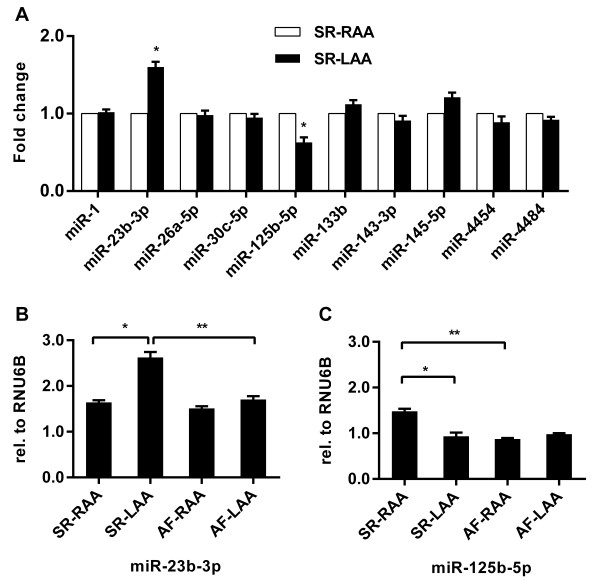
Figure 6.

Comparison of validated AF-associated miRNAs expression level between RAA and LAA in SR status. Data are reported as mean ± standard deviation for three independent experiments, *P < 0.05, compared with SR-RAA (A,B,C); **P < 0.05, compared with SR-LAA (B) or SR-RAA (C).
