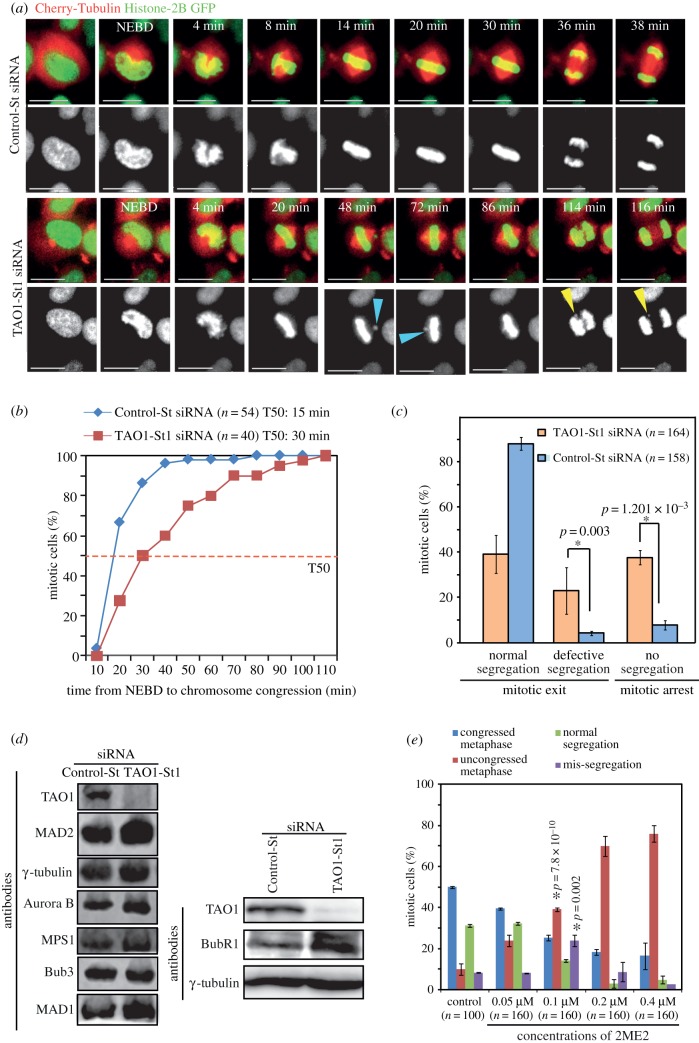
Figure 4.
TAO1-depleted cells display mis-segregating lagging chromosomes. (a–c) Time-lapse analysis of HeLaHis2B-GFP;CherryTub cells transfected with TAO1-St1 or Control-St siRNA. (a) Successive frames of fluorescent images from representative live-cell movies of HeLaH2BGFP;CherryTub cells treated with siRNA as indicated. Images were acquired once every 2 min. Uncongressed chromosomes are marked with blue arrowheads and mis-segregating lagging chromosomes are marked with yellow arrowheads. Scale bar, 20 μm. (b) Cumulative distribution graph showing the time consumed from NEBD to congression of chromosomes (alignment of last chromosome prior to anaphase) in cells treated with TAO1-St1 or Control-St siRNA. T50 represents chromosome congression time in 50% of mitotic cells. (c) Graph showing percentage of mitotic cells displaying normal, defective or no segregation within the first 3 h of mitosis. (d) Immunoblots of lysates of cells treated with siRNA as indicated showing the levels of Mad2, BubR1, Mad1, MPS1, TAO1, Aurora-B, Bub3 or γ-tubulin. γ-Tubulin is used as a loading control. (e) Graph showing percentage of mitotic cells displaying normal or uncongressed metaphase chromosomes and normal or mis-segregated anaphase chromosomes following a 1 h treatment with varying concentrations of 2ME2, as indicated. n = number of cells from three independent experiments. Error bars are s.e.m. values across three experimental repeats. p-Values representing significance level were derived using the proportion test. Asterisks (*) indicate significant difference.

