Figure 5.
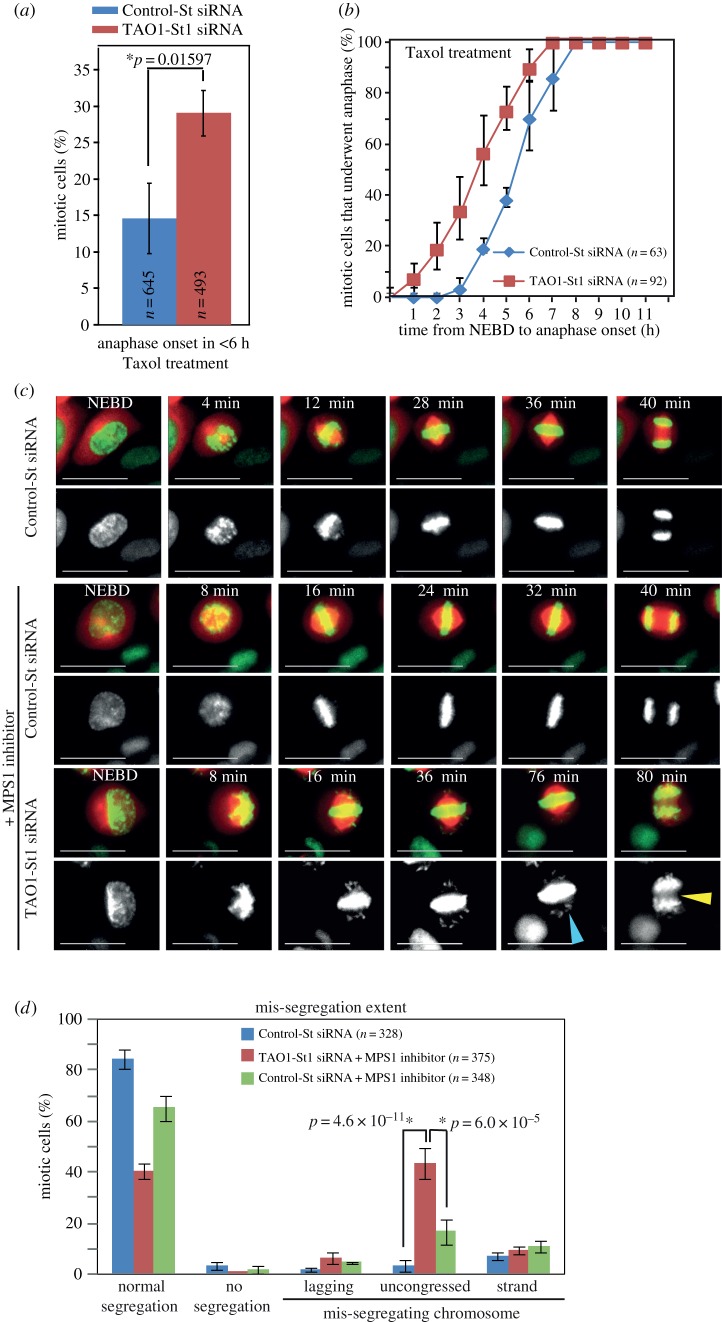
Taxol or MPS1 inhibitor treatments in TAO1-depleted cells. (a) Graph of percentage of cells that underwent anaphase, within 6 h of mitosis onset (NEBD), in HeLaHis2B-GFP;CherryTub cells transfected with TAO1-St1 or Control-St siRNA and exposed to Taxol during imaging. n = number of cells that entered mitosis during imaging from three independent experiments. (b) Cumulative distribution graph of NEBD to anaphase onset times in Control-St or TAO1-St1 siRNA-treated HeLaHis2B-GFP;CherryTub cells that exited mitosis in the presence of Taxol. n = number of cells that underwent anaphase from two different experiments. (c) Time-lapse images of cells treated with siRNA, as indicated, in the presence or the absence of 200 nM MPS1 inhibitor. Yellow arrowhead marks lagging chromosomes in anaphase and blue arrowhead marks unaligned chromosomes. Scale bar, 40 μm. (d) Graph showing mitotic outcome and mis-segregation severity by quantifying the percentage of cells that exhibited normal segregation, no segregation or mis-segregation. Mis-segregating cells were binned as those displaying lagging chromosomes, uncongressed chromosomes at metaphase–anaphase transition or lagging DNA strands as assessed from time-lapse movies as in (c). n = number of cells analysed from three independent experiments. Error bars are s.e.m. values across three experimental repeats. p-Values representing significance level were derived using the proportion test. Asterisks (*) indicate significant difference.

