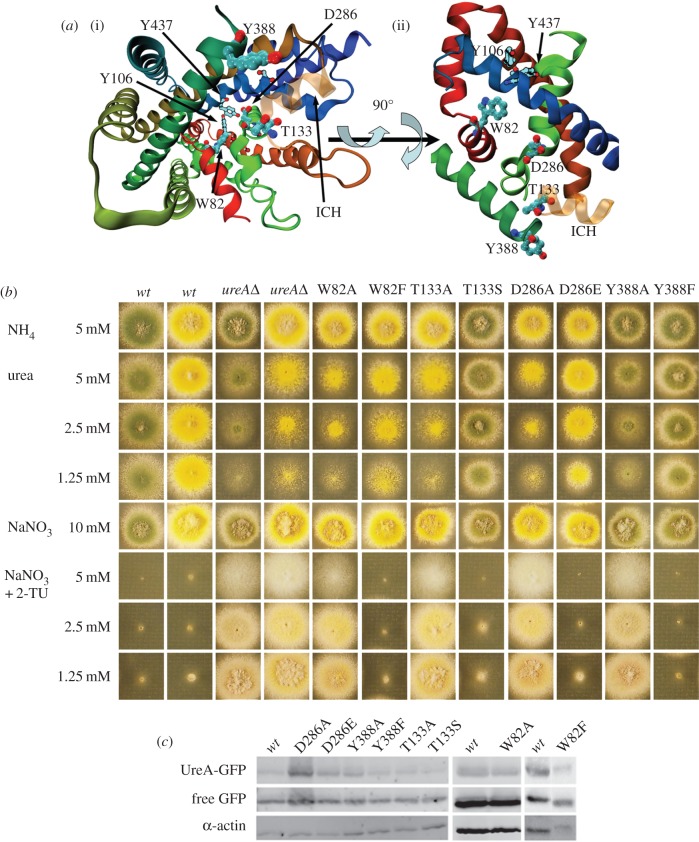
Figure 4.
Analysis of strains bearing mutations in the putative intramolecular urea pathway. (a) Location of the mutated residues. (i) A perspective view into the inward-facing cavity. W82, T133, Y388 and D286 are shown from the cytoplasmic side. Y106 and Y437, which close the cavity, are shown for reference. The colouring of the cartoon is the same as in figure 2. The additional intracellular helix where T133 is located is shown as semitransparent in orange. (ii) A side view of the transporter showing the W82, T133, Y388 and D286 residues in the predicted urea path. For clarity, we show only the helixes where the residues chosen for directed mutagenesis are located. (b) Growth tests of strains bearing mutations in W82, T133, Y388 and D286 residues. Growth conditions were as described in figure 3a. yA+ and yA2 wt strains were used as positive controls so that each mutant strain could be compared with the relevant one. A ureAΔ strain is shown as a negative control. (c) Western blot analysis on total protein extracts of UreA–GFP mutants probed with anti-GFP antibody. See legend of figure 3b for details.

