Figure 1.

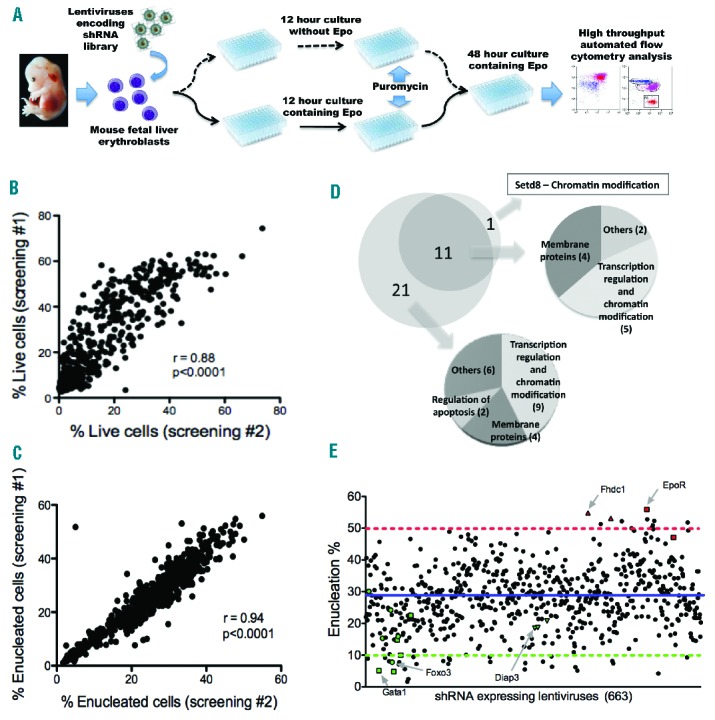
Targeted shRNA screening identified genes that play novel functions in terminal erythropoiesis. (A) A schematic overview of the screening strategies. Dashed and solid lines represent the screening strategies for the early and late stages of terminal erythropoiesis, respectively. (B–C) Correlation coefficient of duplicate sets of screens for the dashed (B) and solid (C) line methods. (D) Pie graph of hit genes and their functions in other types of cells based on DAVID bioinformatics resources.28,29 (E) Summary of flow cytometric analysis of enucleation screening. Each dot indicates the enucleation rate of cells transduced with single distinct shRNA encoding lentiviruses. Control genes (green) and genes that gave higher enucleation rate after knockdown (red) are highlighted in arrow. The blue line indicates mean enucleation rate. The dotted red and green lines indicate the upper and lower limits for the selection of hit genes, respectively.
