Figure 4.
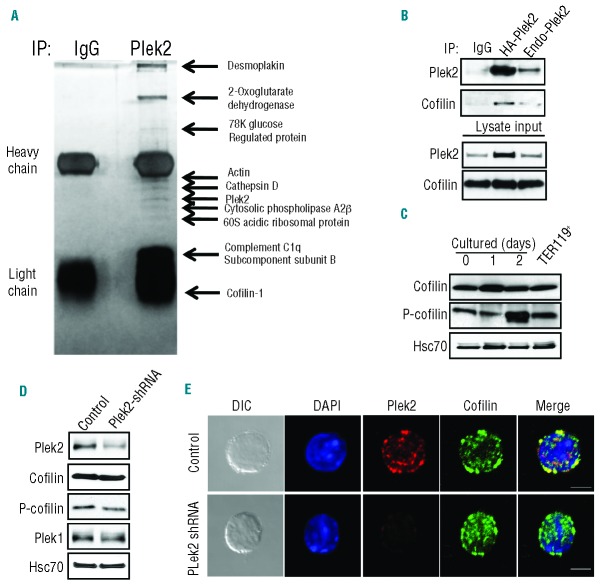
Plek2 interacts with cofilin. (A) Proteomic study of plek2 interacting proteins. TER119 negative mouse fetal liver erythroblasts were purified and cultured for 30 h in Epo medium. The cells were harvested and lysed. Immunoprecipitation of the cell lysates using rabbit normal IgG and rabbit anti-plek2 were performed separately followed by a silver stain. The distinct protein bands were extracted and submitted for a mass spectrometry analysis. The identified proteins are listed on the right. (B) Immunoprecipitation (IP) of plek2 was performed on HA-plek2 retroviral transduced and non-transduced mouse fetal liver erythroblasts (Endo-plek2) followed by a Western blot analysis of cofilin to detect co-IP. IgG was used as an IP control. (C) Western blot analysis of cofilin and phospho-cofilin levels in freshly purified mouse fetal liver TER119 negative erythroblasts (Day 0) and Epo medium cultured erythroblasts on different days. TER119+ represents freshly purified TER119 positive fetal liver erythroid cells. Hsc70 was used as a loading control. (D) Western blot analysis of plek2, cofilin and plek1 in control and plek2 shRNA knockdown mouse fetal liver erythroblasts in the early stage of terminal erythropoiesis. Hsc70 was used as a loading control. (E) Confocal microscopy of plek2 (red) and cofilin (green) in control cells and cells with plek2 knockdown. The cells were transduced with MSCV encoding control or plek2 shRNA and cultured in SCF medium for 12 h, which was followed by Epo medium culture for 12 h before being fixed for staining. Scale bar: 5 μm. The confocal images were representative optical sections of the cell from at least 50 cells in each condition in 3 different experiments.

