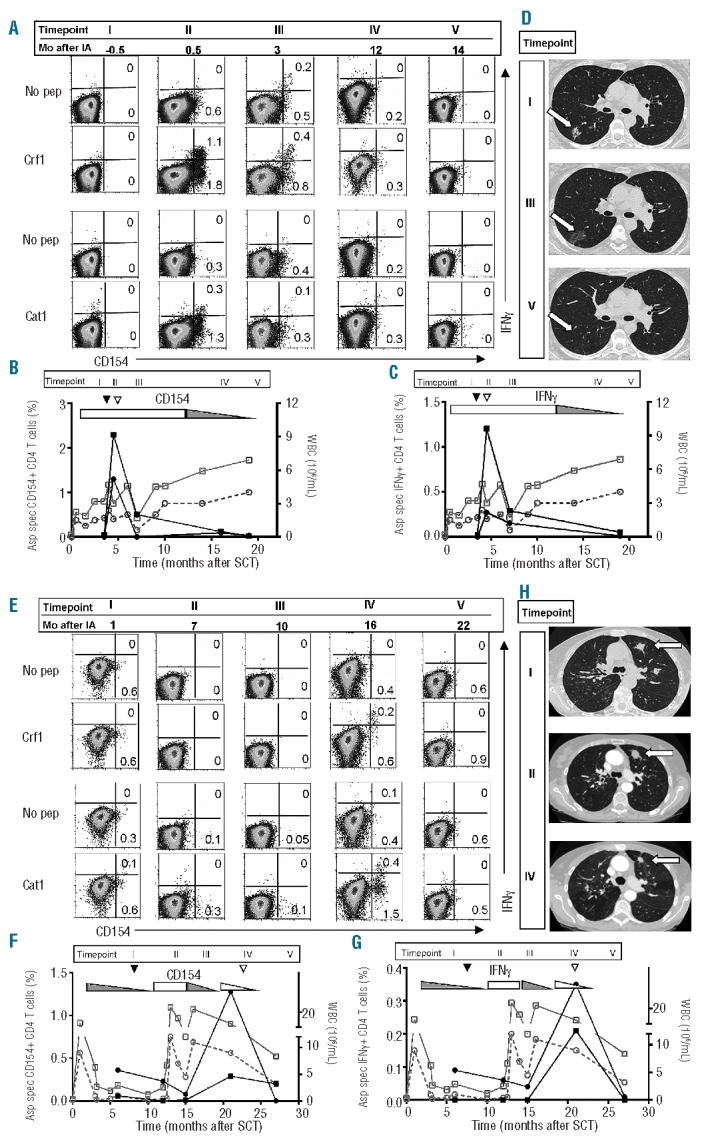
Figure 1.

Aspergillus-specific T-cell responses and imaging studies in patients with improvement of invasive aspergillosis. FACS-analyses imaging studies and kinetics of the Aspergillus-specific T-cell responses of patient MLF (A–D) and patient TPA (E–H). (A and E) FACS analyses were performed on PBMC that were stimulated with Crf1 or Catalase1, and restimulated with Crf1- or Catalase1-pulsed PBMC or with unpulsed PBMC (no pep). T cells were analyzed 5 h after restimulation and FACS-plots are gated on CD4+ T cells. The kinetics of the percentages of Crf1- (■) and Catalase1-specific (•) CD154+ CD4+ T-cells (left y-axis, B and F) and IFNγ+ CD4+ T cells (left y-axis, C and G) and absolute leukocyte (□) and granulocyte counts (○) (right y-axis) are shown before and after diagnosis (▼) and improvement (▽) of aspergillus infection. Use of topical (▭) and systemic (▬) immunosuppression and lowering of the dose (◺,◣) during the study period are depicted in the graphs. Percentages of Aspergillus-specific CD154+ CD4+ T cells were calculated as % CD154+ of CD4+ T cells after restimulation with peptide-pulsed PBMC minus % CD154+ of CD4+ T cells after restimulation with unpulsed PBMC. The same method of calculation was used for IFNγ+ CD4+ T cells. Pulmonary CT scans of patient MLF (D) and patient TPA (H) at different time points after diagnosis show the changes in the size of aspergillus lesions during the course of infection Aspergillus lesions on the CT scans are indicated with an arrow. The timepoints indicated by Roman numerals in the top of the graphs in (B) and (C) and in (F) and (G) correspond to the time points of FACS analyses and CT scans in respectively (A) and (D), and (E) and (H). In figure (A) and (E) the corresponding period in months after invasive aspergillosis (Mo after IA) is given for every timepoint. SCT: stem cell transplantation; WBC: white blood cells.
