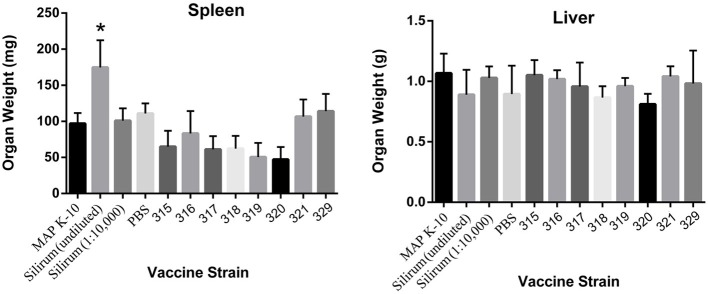
Figure 4.

Induction of splenomegaly in undiluted Silirum vaccinated mice at 18 weeks post vaccination. The graphs show the average spleen and liver weights of 5 mice per group. Statistically significant differences in spleen size of undiluted Silirum treated mice compared to other treatment groups are indicated by an asterisk (P < 0.05 for 329; P < 0.01 for 321 and PBS; P < 0.005 for K-10, diluted Silirum and 316; P < 0.0005 for 315, 317, 318, 319, and 320).
