Figure 4.
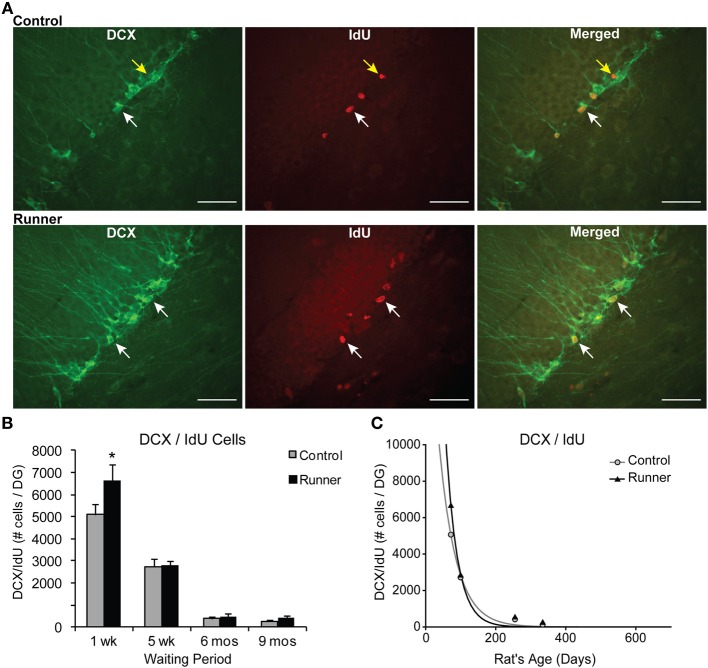
Neuronal differentiation and survival in 1 week old neurons. (A) Confocal microscopic images (40×) showing DCX and CldU labeled cells in the DG of 10 week old Control (top panels) and Runner (bottom panels). White arrows indicate double-labeled cells, and yellow arrow indicates single-labeled CldU cell. Scale bar, 50 um. (B) Numbers (mean ± s.e.m.) of dual-labeled DCX/IdU cells. Runners in the 1 week cohort (10 weeks of age) showed significantly more dual-labeled cells than Controls (Two-Way ANOVA, *P = 0.007). There were no differences between Runners and Controls in any other group. (C) Exponential decay curve for DCX/IdU shows parameters a = 22.120 and b = 0.0206 in Controls and a = 58.070 and b = 0.0301 in Runners. The data from the regression analysis is consistent with higher initial cell numbers in Runners early on, but faster decay with age.

