
Figure 3.
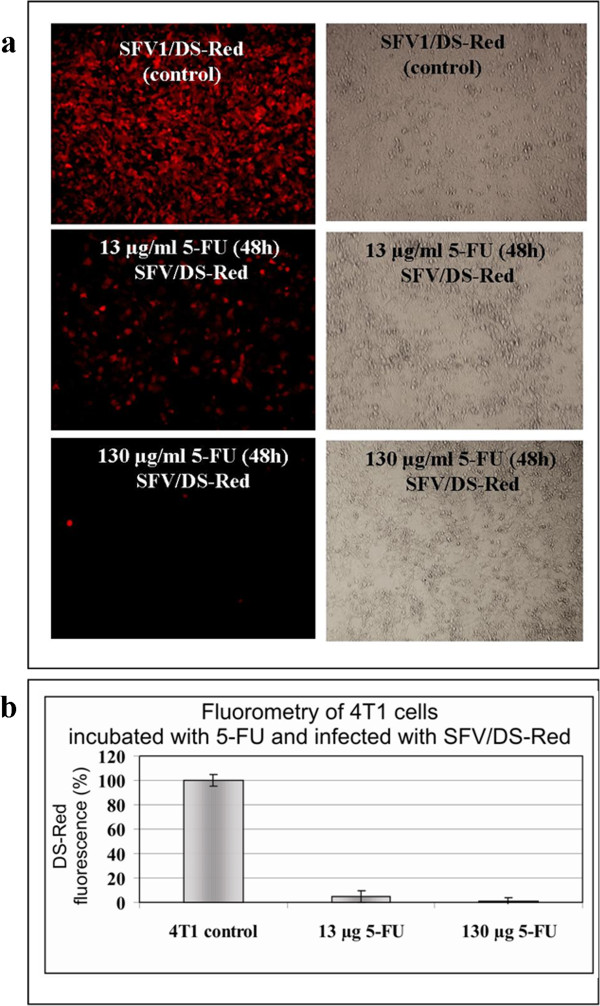
Inhibition of SFV/DS-Red infection in 4 T1 cells pretreated with 5-FU. 4 T1 cells were treated with high (130 μg ml−1) or low (13 μg ml−1) concentrations of 5-FU for 2 days, then infected with SFV/DS-Red particles. (a) Fluorescence and phase contrast microscopy pictures. (b) Fluorometric measurement of DS-Red fluorescence in infected cells at 24 h post-infection. The diagram shows the percentage of fluorescence units measured in the cells pretreated with 5-FU (13 μg ml−1 or 130 μg ml−1) and then infected with SFV/DS-Red relative to 4 T1 control cells (100%) that were only infected with SFV/DS-Red. The error bars indicate the standard error of three independent experiments.