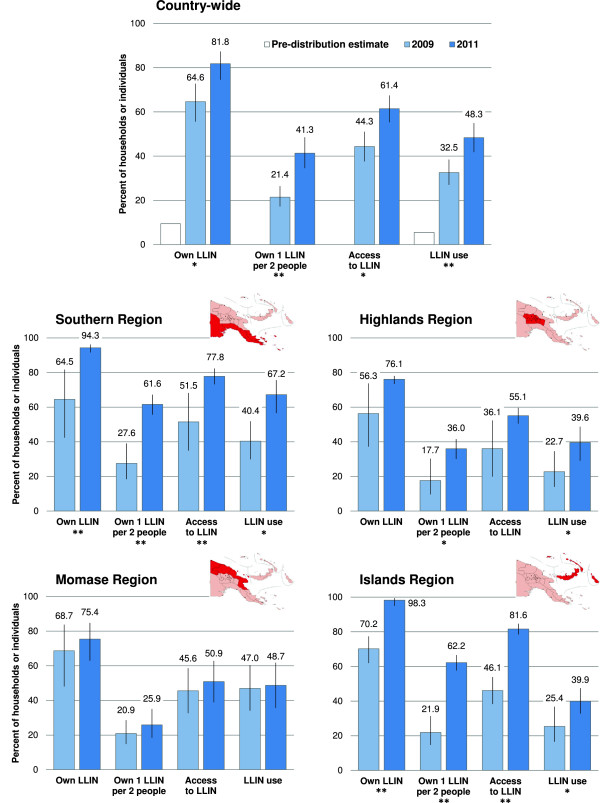
Figure 2.

National (top) and regional changes in LLIN ownership and use between surveys in 2009 and 2011. Region highlighted in red on maps. Error bars represent 95% confidence intervals. Pre-distribution estimate and 2009 data derived from Hetzel et al.[1]. Statistical significance of differences in indicators between years: *P < 0.05, **P < 0.001.
