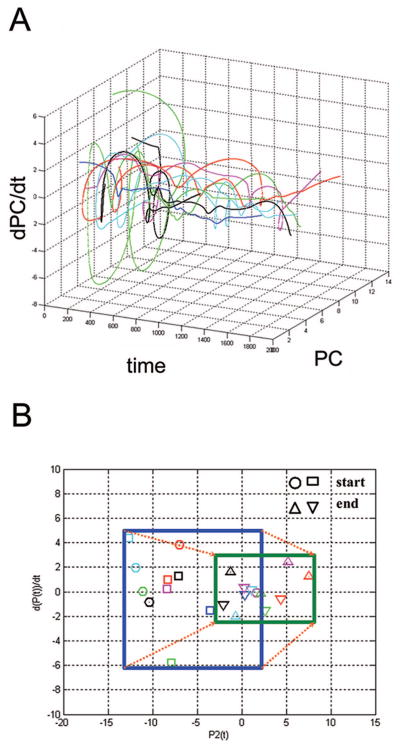
Figure 2.
Riboleukograms of critically ill and injured patients. As reported recently, application of immune cartography in the clinical setting provides dynamic, RNA-based graphs of the leukocyte response, which we term riboleukograms (10). A, Phase space analysis of circulating leukocyte expression profiles for human genes informational for ventilator-associated pneumonia complicating recovery. All 11 patients were treated with the appropriate antibiotic(s) for their infecting pathogen and all patients were discharged from the intensive care unit. Individual patient trajectories start at various points in space and marked heterogeneity is observed, but all of the riboleukograms converge as they move to the right to a common region of the graph. Furthermore, these data suggest that a trajectory specific for each patient (riboleukogram) could be plotted daily based upon leukocyte RNA data, and the distance from the attractor could be measured indicating whether the patient was healing or not (“genomic vital signs”). B, Starting points (critically ill, blue box) and ending points (recovery, green box) of riboleukograms for the same 11 patients. All paths move to the right from a larger (blue) to a smaller (green) box. This behavior mimics that of an attractor in the physical sciences, consistent with critical illness complicated by ventilator-associated pneumonia perturbing a stable immune state that returns to homeostasis. We submit that this general method can be used to characterize, monitor, and ultimately recognize infection in patients in whom the diagnosis of sepsis is particularly difficult to make (10).

