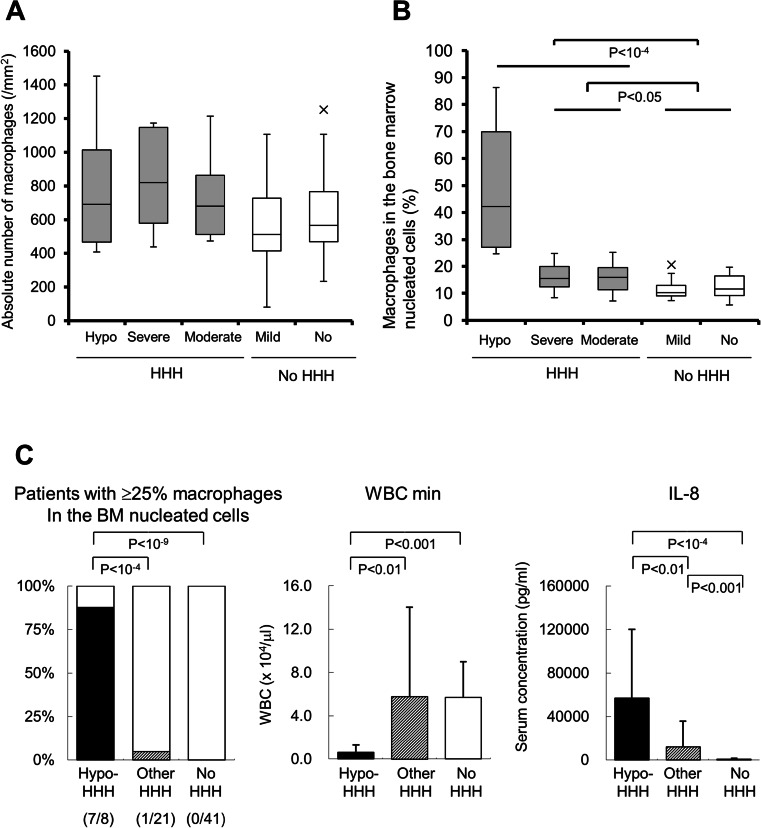
Fig. 4.
Features of hypo-HHH. a Absolute number of CD68-positive macrophages in the bone marrow in different types of HHH. b Percentage of macrophages in the bone marrow nucleated cells in each category. Grey bars represent data derived from HHH patients, and open bars represent data from non-HHH patients. The data are shown by a box and whisker plot. X’s indicate statistical outliers. c Characteristics of hypo-HHH in comparison with other-HHH and non-HHH patients. Closed bars represent data from hypo-HHH patients, oblique bars represent data from HHH patients, and open bars represent data from non-HHH patients. Data are presented as the mean ± standard deviation. WBC min, minimum number of white blood cells; HHH, histiocytic hyperplasia of hemophagocytosis; hypo-HHH, hypoplastic HHH

