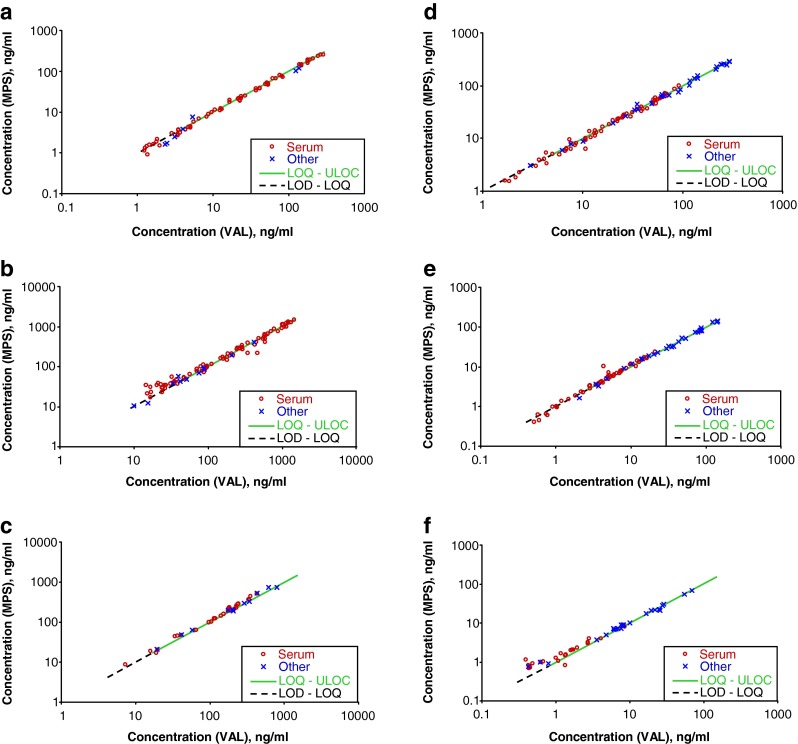
Fig. 7.

Correlation of measured analyte concentrations in double logarithmic scale. Line with a slope of one (dashed black in the range from LOD to LOQ and solid green in the range from LOQ to ULOC)—representing the complete equivalence of results—is shown. VAL validated partly automated method; MPS fully automated method performed on a MultiPurpose Sampler (MPS); ng/ml nanogram per milliliter or nanogram per gram if tissue is used, respectively; Other other matrices than serum—urine, blood, lyophilized kidney tissue, heart blood, lyophilized, and native brain tissue; LOD limit of detection; LOQ limit of quantification; ULOC upper limit of calibration. a Cocaine. b Benzoylecgonine. c Methadone. d Morphine. e Codeine. f 6-Monoacetylmorphine
