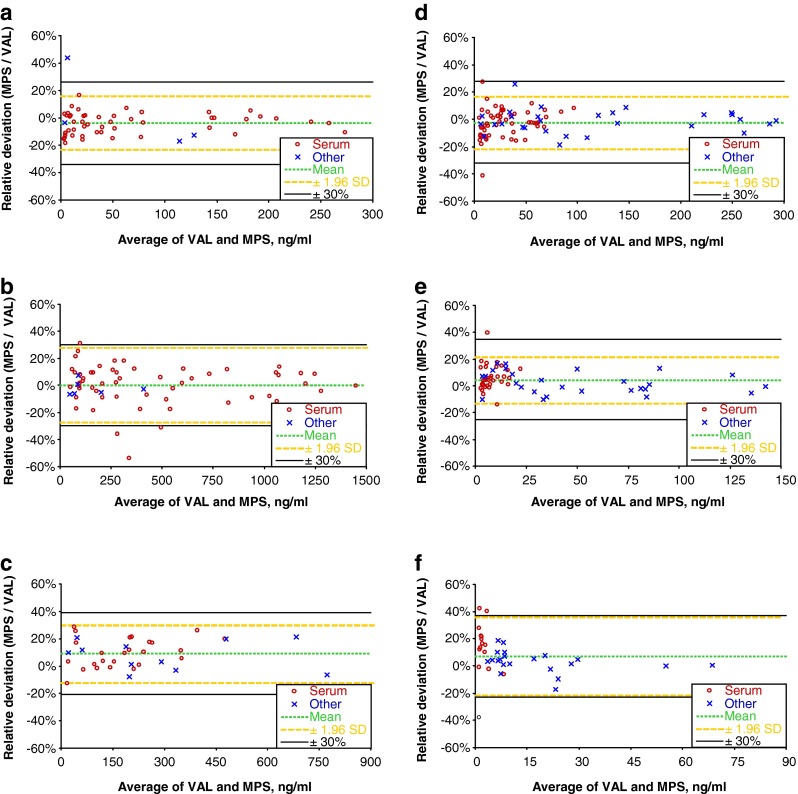
Fig. 8.

Relative deviations of measured concentrations displayed as Bland-Altman plots. Only analysis values above the limit of quantification are plotted. VAL validated partly automated method; MPS fully automated method performed on a MultiPurpose Sampler (MPS); ng/ml nanogram per milliliter or nanogram per gram if tissue is used, respectively; Other: other matrices than serum—urine, blood, lyophilized kidney tissue, heart blood, lyophilized, and native brain tissue; Mean mean deviation or bias in percent; SD standard deviation of percent deviations for each single sample. a Cocaine. b Benzoylecgonine. c Methadone. d Morphine. e Codeine. f 6-Monoacetylmorphine
