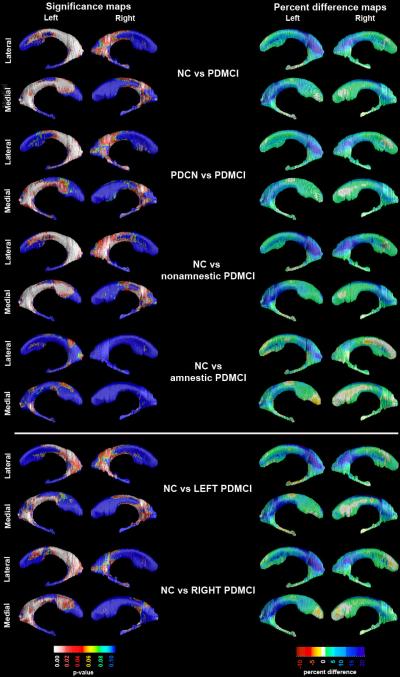
Figure 4.
3D significance (left panel) and percent difference (right panel) NC vs. PDMCI ventricular radial distance maps. Red and white areas in the significance maps show statistical significance (p<0.05). The following maps survived stringent correction for multiple comparisons: NC vs. PDMCI, PDCN vs. PDMCI, NC vs. nonamnestic PDMCI and NC vs. left-predominant PDMCI bilaterally, as well as NC vs. right-predominant PDMCI on the left.

