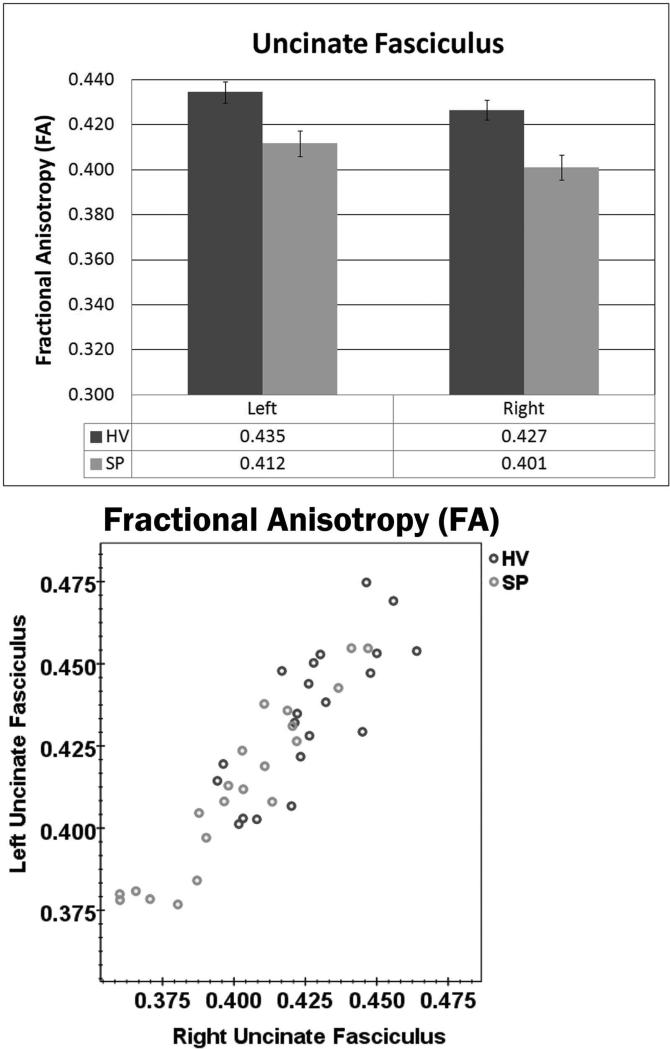
Figure 6.
Upper panel: SP showed lower FA in the uncinate fasciculus compared to HV in the left and right hemispheres. Overall, FA in the uncinate fasciculus was found to be lower in the right hemisphere than the left. Lower panel: This scatter plot illustrates the distribution of FA values for all participants and the strong correlation that was found between rightand left-hemisphere uncinate fasciculus FA (r = .905, p < .001).

