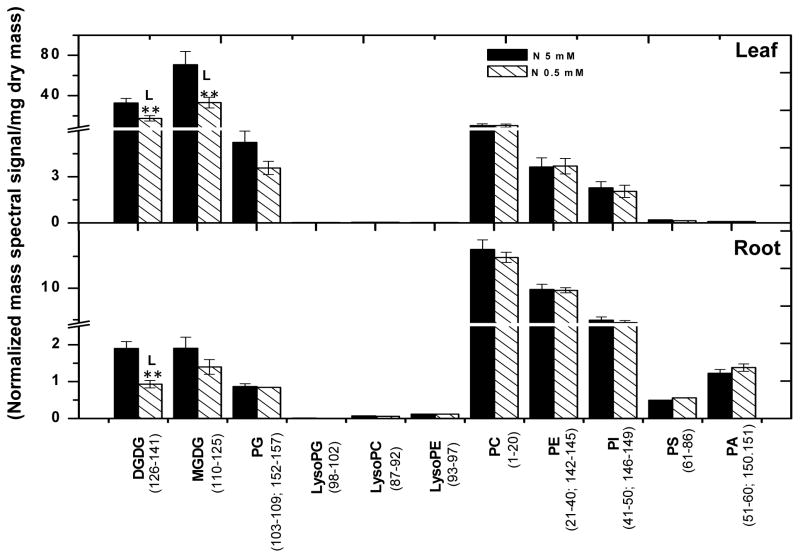
Figure 2. Total polar glycerolipids in organs of nitrogen sufficient (solid bars) and deficient (hatched bars) soybean seedlings.
Lipids were extracted from 15 days old soybean leaves and roots grown under nitrogen sufficient (5 mM) and deficient conditions (0.5 mM). The total polar glycerolipid amounts are expressed as normalized mass spectral signal/mg dry mass. The values are the mean ± SE (n = 15). P < 0.05 is indicated by * and P < 0.01 by **. The value for N-deficient seedlings is higher (represented by H) or lower (represented by L) than the value for N sufficient seedlings.

