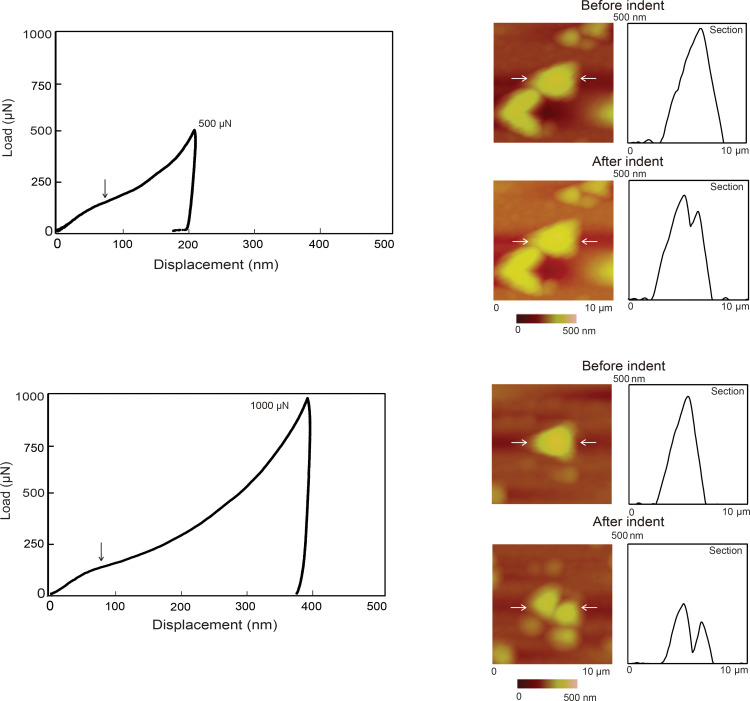
Figure 9.
Load displacement curves for intermediate loads 500 µN and high loads 1000 µN for Au 500 with the vertical arrows depicting slip events (left), and topography maps and 2-D profiles, at sections indicated by the horizontal arrows before indentation (first row) and after indentation (second row) (right).

